The Environmental Modeling Center's Model Evaluation Group (MEG) formed in 2012 with the goal of bolstering statistical evaluation of NCEP model forecasts with evaluation from a synoptic, sensible-weather perspective. Presentations are given weekly, covering topics that include case studies of high-impact weather events, the performance of parallel models, model biases, and other model behaviors requiring documentation or fixes. Presentations are also occasionally given by interested members of the NWS and academic communities.
Our mission: The mission of the National Weather Service (NWS) Model Evaluation Group (MEG) at the Environmental Modeling Center (EMC) is to verify, validate, and evaluate all current and proposed NWS real-time numerical Earth System Models (ESMs) in coordination and communication with NWS Regions, National Centers, and public and private partners.
About the Model Evaluation Group
Information
MEG meetings are held most Thursdays at 11:30a.m. ET. Contact a group member to be added to a list for email announcements and dial-in information.
Model feedback is always appreciated and can be directed to any group member.
The MEG is:
Model feedback is always appreciated and can be directed to any group member.
The MEG is:
Alicia Bentley (Alicia.Bentley@noaa.gov)
Shannon Shields (Shannon.Shields@noaa.gov)
Marcel Caron (Marcel.Caron@noaa.gov)
Roshan Shrestha (Roshan.Shrestha@noaa.gov)
Examples of Past MEG Presentations
Access to past MEG presentations is directly available to those with a noaa.gov email address and also upon request.
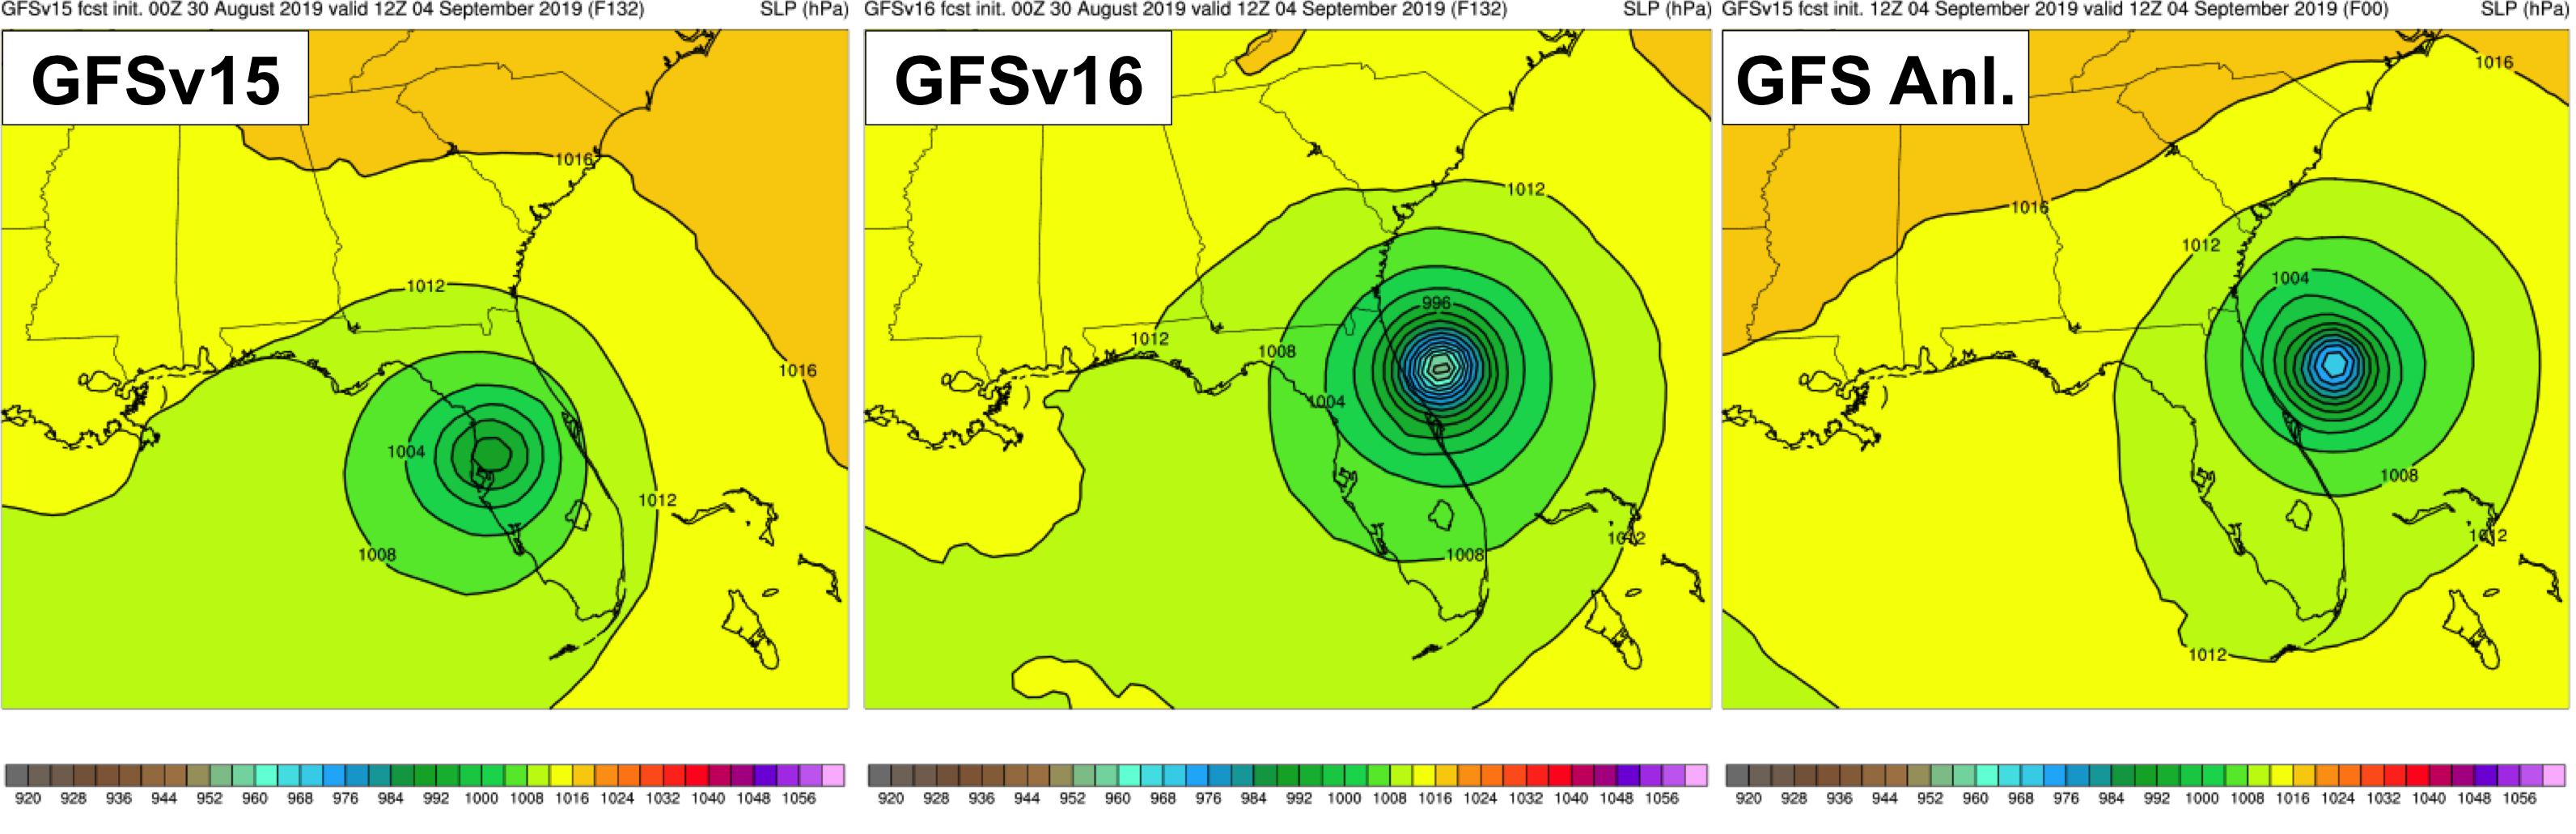
The MEG led the official evaluation of GFSv16 (Weather: Days 1-10) during August/September 2020 by examining ~1.5 years of retrospective forecast statistics and 50 retrospective case studies to accompany the statistical assessment. Strengths of GFSv16 include higher 500-hPa AC scores and improved synoptic predictability, mitigation of the low-level cold bias seen in GFSv15 during the cool season, improved TC track and intensity forecasts in the medium range (see image above), improved precipitation and snowfall forecasts, and an improved ability to capture temperature profiles in shallow, cold air masses. The link to the GFSv16 Official Evaluation webpage can be found here.
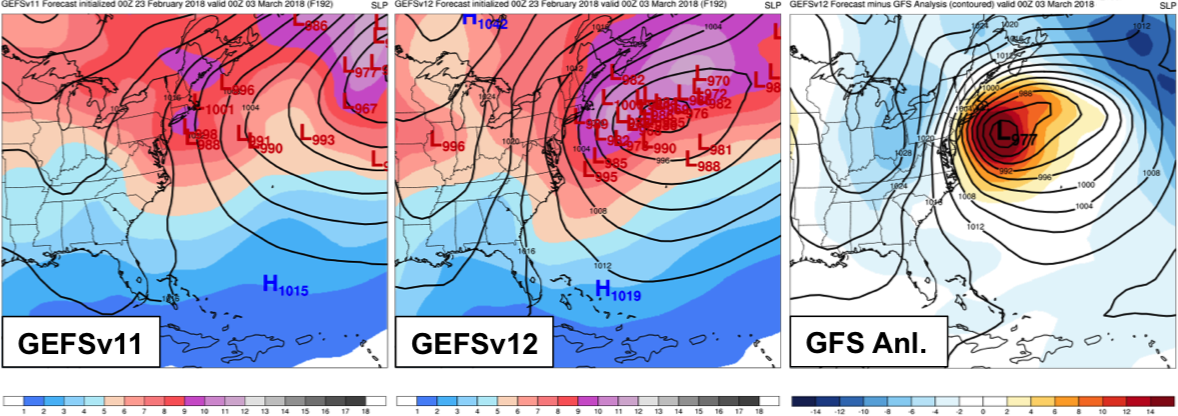
The MEG led the official evaluation of GEFSv12 (Weather: Days 1-10) during March/April 2020 by examining 2.5 years of retrospective forecast statistics and 45 retrospective case studies to accompany the statistical assessment. Strengths of GEFSv12 include higher 500-hPa AC scores and improved synoptic predictability, increased ensemble spread, improved TC tracks/spread, better handling of deepening extratropical cyclones (see image above), more reliable precipitation forecasts, improved representation of weather events near topography, and the mitigation of offshore QPF maxima. The link to the GEFSv12 Official Evaluation webpage can be found here.
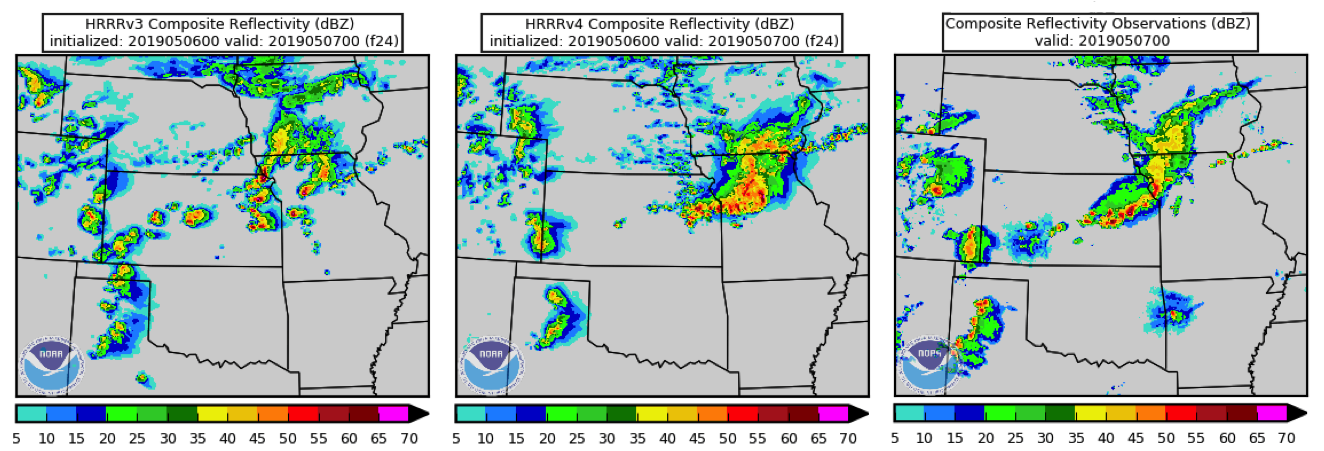
The MEG led the official evaluation of RAPv5/HRRRv4 during October-December 2019 by examining forecasts and statistics from real-time and retrospective forecast periods. Strengths of RAPv5/HRRRv4 include more realistic depiction of clouds and temperatures beneath cloud cover, better temperatures for small lakes/Great Lakes, better wind fields over water, better handling of organized convection at longer time ranges (see image above), stronger updraft helicity signals, better instability forecasts along boundaries, prediction of explicit smoke, improved snowfall totals (new snow-liquid-ratio methodology), and better simulated reflectivity in winter events. The link to the RAPv5/HRRRv4 Official Evaluation webpage can be found here.
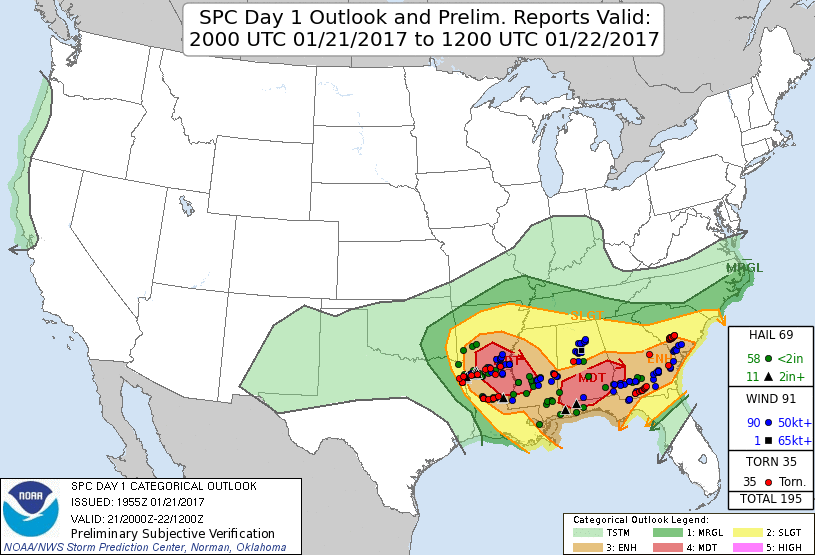
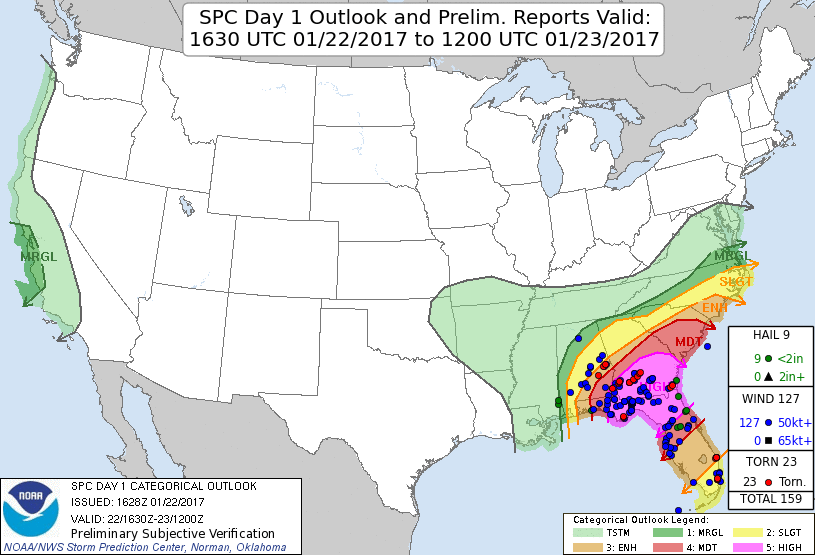
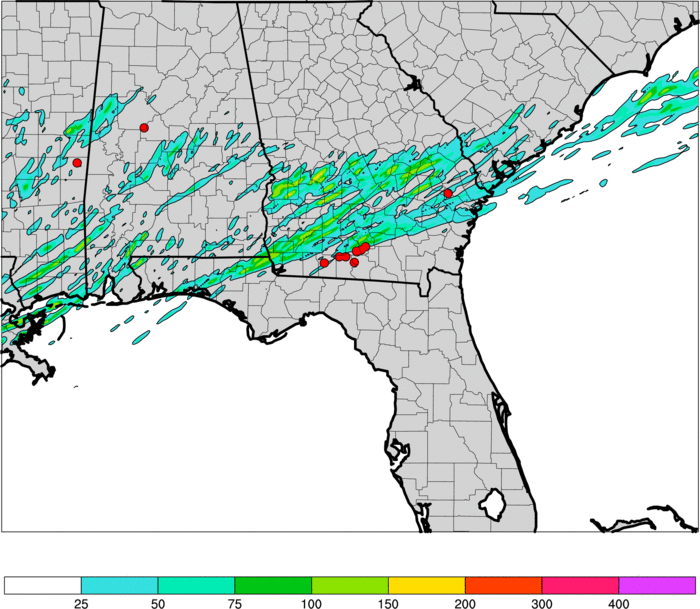
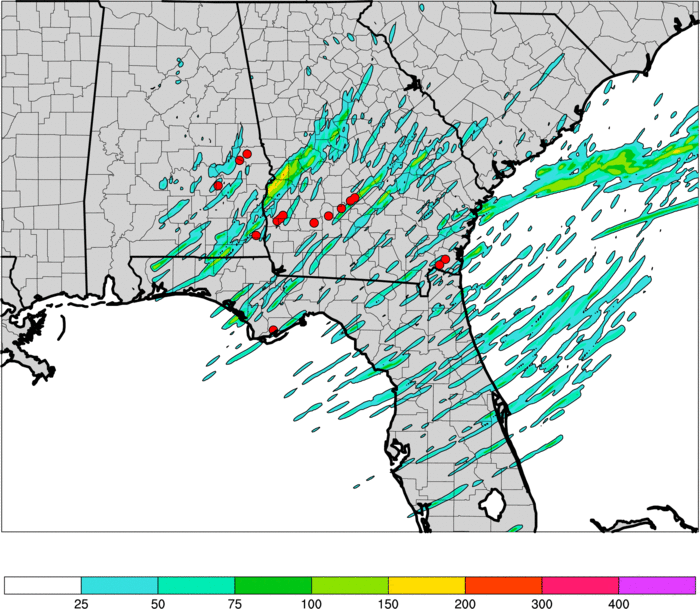
A multi-day severe outbreak in January 2017 concluded with a large high risk issued by the Storm Prediction Center over southern Georgia and northern Florida on 22 January (top right). Despite large probabilities for siginificant tornado formation, the day was less active than 21 January (convective outlook and reports top left). While severe parameters human forecasters rely on reached extreme values over Florida and supported the issuance of a high risk, HRRR forecasts were less indicative of a 22 January Florida tornado outbreak. In both the 04Z 22 initialization (bottom left) and 17Z 22 initialization (bottom right), the 12-h maximum updraft helicity fields, a field commonly used to assess severe threat in a model, ending 16Z 22 and 05Z 23, respectively, restricted the largest values to areas in Georgia where tornadoes were observed (red markers). Over Florida, values were more modest. These HRRR forecasts are an example of a model success in which the model may have identified factors limiting severe potential that the human forecasters could not detect.
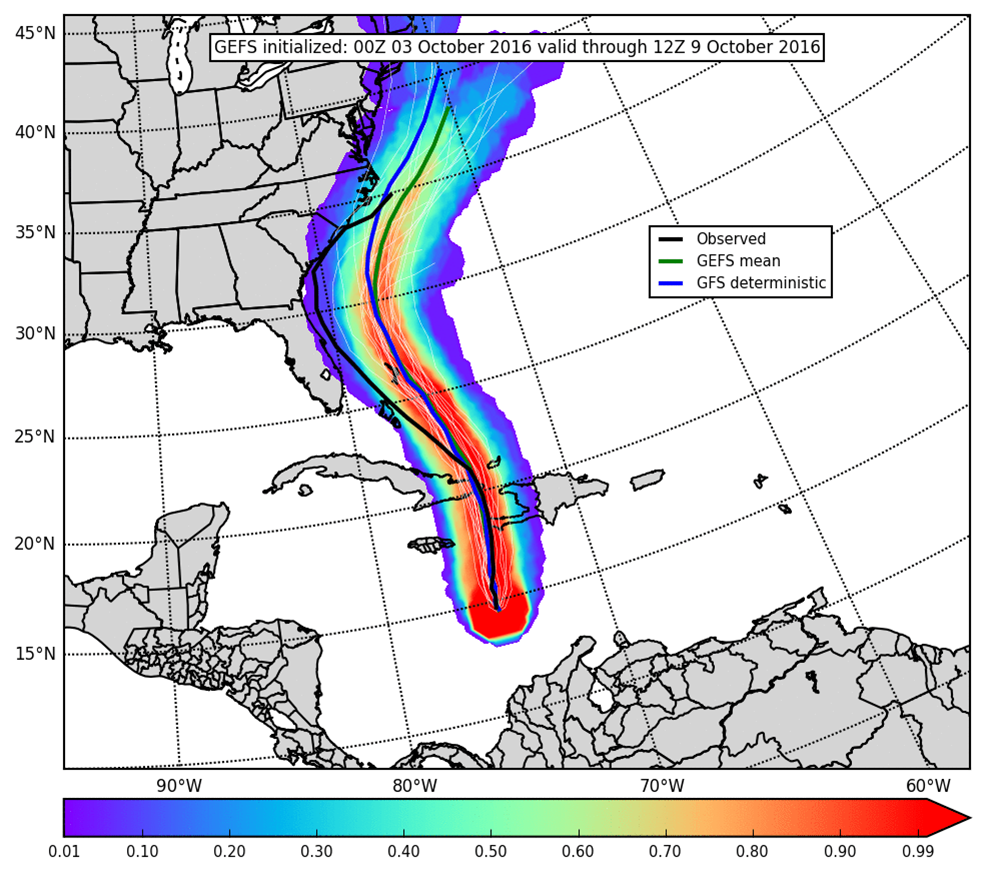
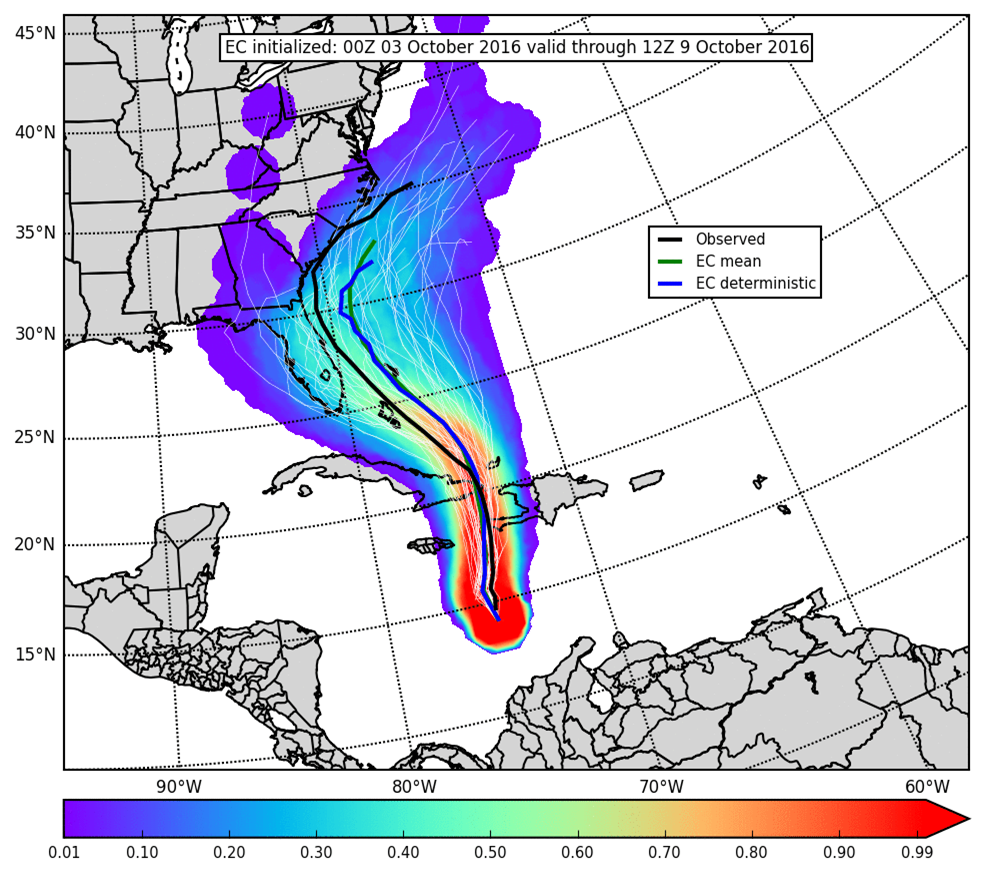
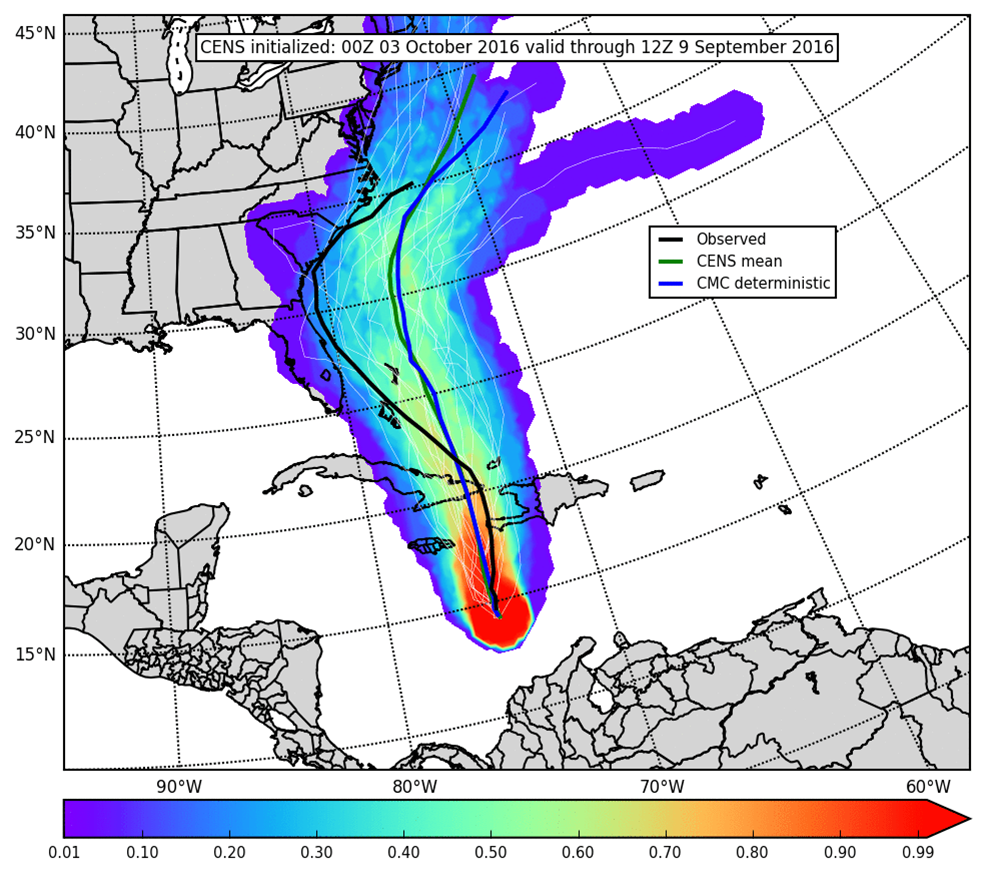
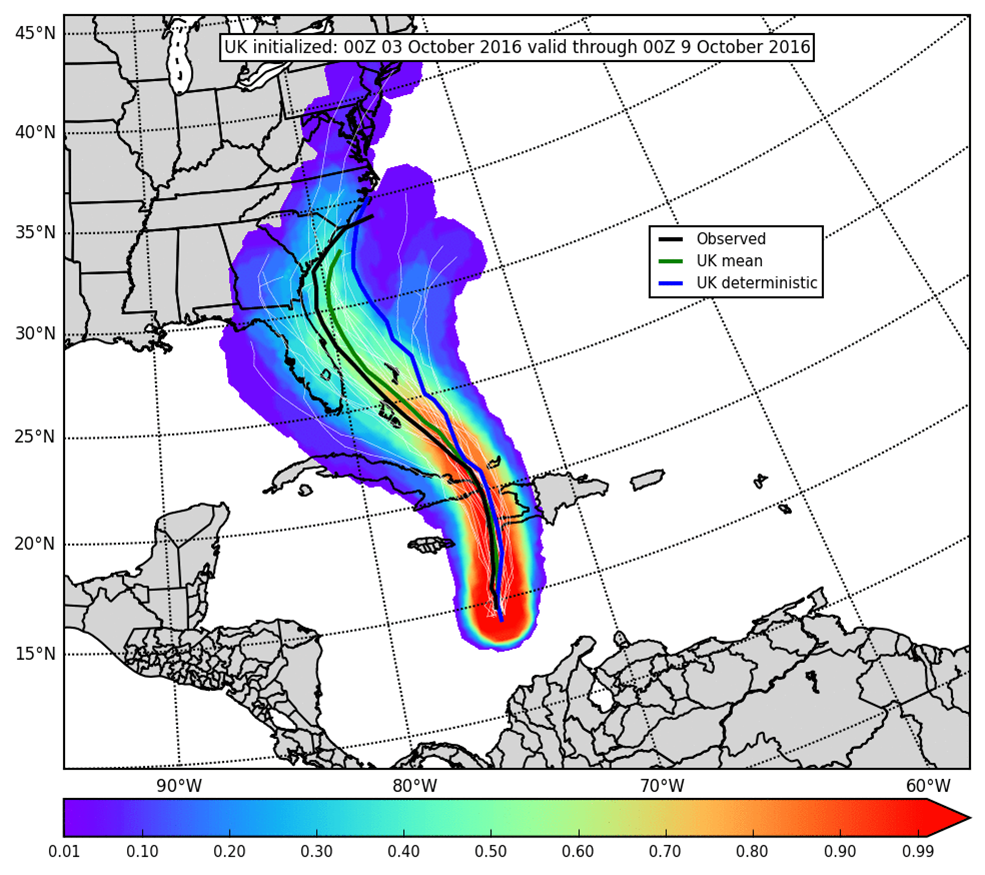
In the medium range, when Hurricane Matthew was still south of Cuba, its track was uncertain. Specifically, it was unclear how close Matthew would come to Florida. Four global ensemble systems are shown here: the GEFS (top left), European (top right), Canadian (bottom left), and UK (bottom right). In this 00Z 03 October 2016 cycle, the observed track of Matthew was outside the range of GEFS solutions. The observed track was also nearly outside the range of Canadian solutions. The European ensemble better captured the possibility of a Matthew track near the coast of Florida, and the UK ensemble was most accurate with its ensemble mean slightly east of the observed track. Ultimately, Matthew tracked far enough off the Florida coast for Florida to avoid widespread significant damage.