 |
N-LDAS meetings
|
N-LDAS meeting at OH, NOV 14, 2001
- Forcing Validation using Oklahoma Mesonet data.
The major variables (precipitation, shortwave radiation, surface pressure, air temperature and
wind speed) have been compared with the Oklahoma Mesonet observations at the grids
where the stations are located.
- Test run of Oklahoma Mesonet forcing with VIC model
Two months simulations driven by the forcing generated from Oklahoma Mesonet
observations from VIC model are shown here. VIC has show numerical instability when the
local precipitation is very large, e.g. APAC,NORM.
- LDAS Oklahoma Mesonet forcing is ready to use.
- MOSAIC output is currectly under analysis.
- We now have only the daily averaged time series at all the Mesonet stations available.
Realtime model output viewer of several models outputs. (in progress for
improvement)
N-LDAS Teleconference, NOV 28, 2001
- The soil temperature from Mosaic.
The soil temperature from MOSAIC has a low bias during winter time, even though we do not
know which depth this soil temperature was originally validated against, but it is a "deep layer
soil temperature".
- NOAH and SAC model output are not ready yet. Hopefully, we will get them by next
meeting.
- ARM/CART sites will be added to the new forcing data to validate the fluxes.
AMS annual meeting Jan 13-Jan18 2002
- The presentation

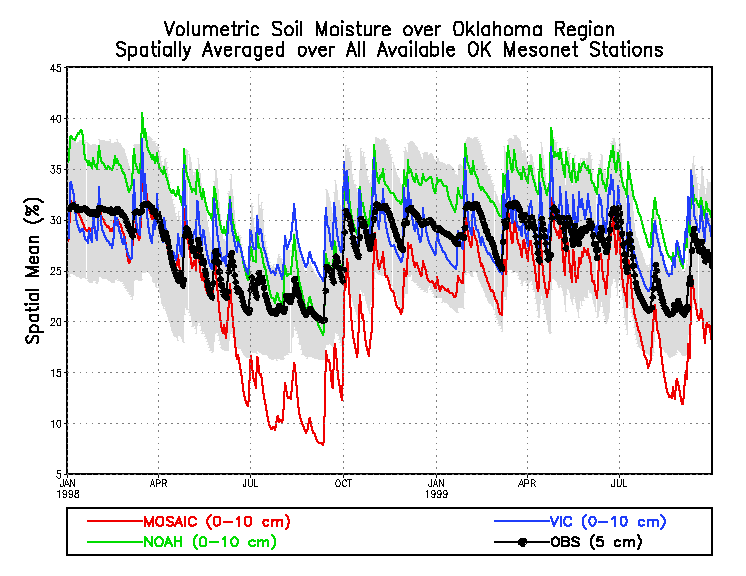
- Soil moisture average over all mesonet stations.
GIF|EPS
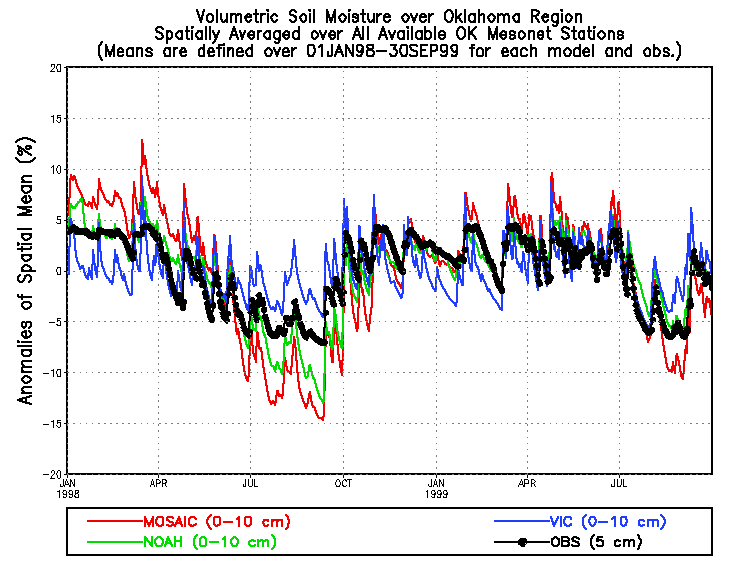
- Soil moisture anomalies.
GIF|EPS
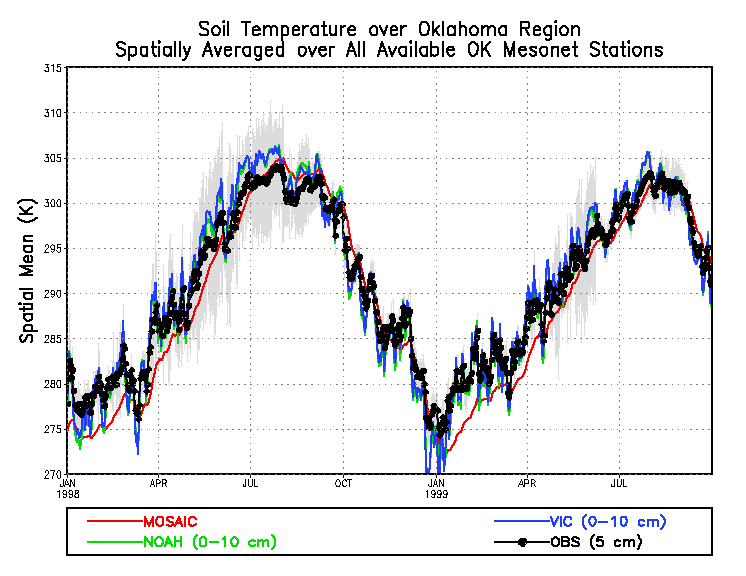
- Soil temperature average over all mesonet stations.
GIF|EPS
- Surface fluxes, monthly mean for MAY99.
NOAH: GIF|EPS
VIC : GIF|EPS
MOSAIC : GIF|EPS
- Using VIC as an example to show the importance of surface soil texture.
ALTU: LDAS soil type: clay loam, station soil type: clay loam. GIF | EPS
MANG: LDAS soil type: clay loam, station soil type: sand GIF | EPS
- Results from the experiment
Soil Moisture
GIF | EPS
Fluxes:
NOAH GIF | EPS
MOSAIC GIF | EPS
EGS meeting at Nice for Alan
- The presentation
- Oklahoma Mesonet station map
PNG | EPS
- The scatter plot of surface pressre
GIF | EPS
- The scatter plot of 2-m air temperature
GIF | EPS
- The scatter plot of specific humidity
GIF | EPS
- The scatter plot of 10-m wind speed
GIF | EPS
- The scatter plot of shortwave radiation
GIF | EPS
- The scatter plot of longwave radiation
GIF | EPS
- The scatter plot of precipitation
GIF | EPS
- The map of percentage difference of total precipitation
GIF | EPS
- The map of percentage difference of total downward shortwave radiation
GIF | EPS
- The time series of the spatially average top 10cm soil moisture from all models.
PNG | EPS
- The time series of the spatially average top 10cm soil temperature from all models.
PNG | EPS
- The time series with mean removed of the spatially average top 10cm soil moisture from all models.
PNG | EPS
- Difference of soil moisture between two experiments.
GIF | EPS
- Percentage difference of soil moisture between two experiments.
GIF | EPS
- Simulations over grid where LDAS uses the same soil type as observed at Mesonet station
GIF | EPS
- Simulations over grid where LDAS uses the different soil type as observed at Mesonet station
GIF | EPS
Mississippi River Climate and Hydrology Conference at New Orleans, LA, May 2002
NLDAS Meeting at Princeton, July 23, 2002
Figures for the forcing validation paper
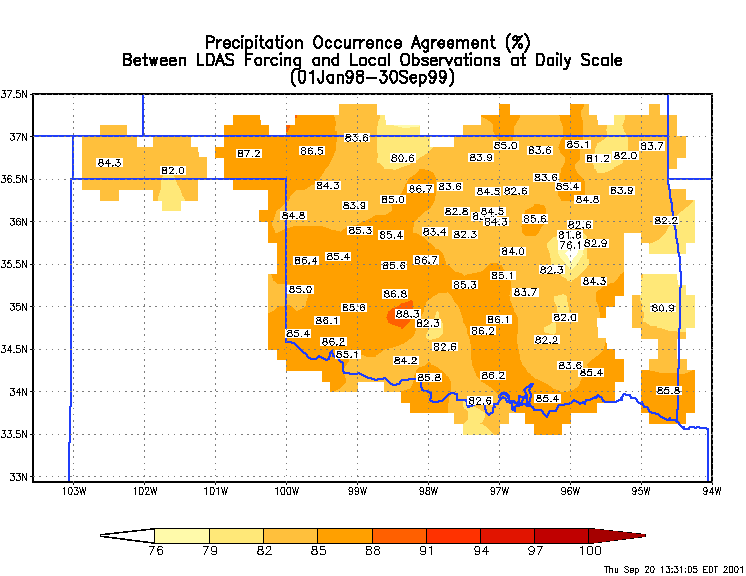
- The agreement between LDAS precipitation (grid) and Oklahoma Mesonet station observed precipitation (point) in terms of occurrence at daily scale.
PNG
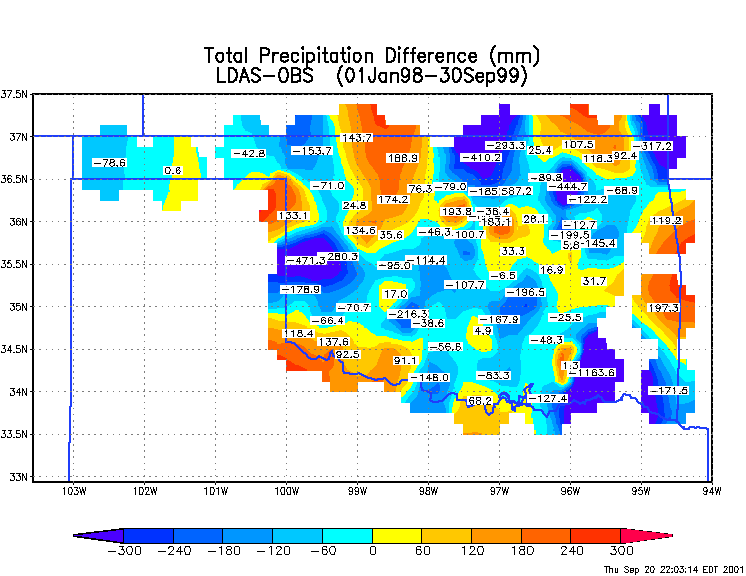
- The difference in total precipitation between LDAS grided and observations reported by Oklahoma Mesonet stations during the period shown above.
PNG
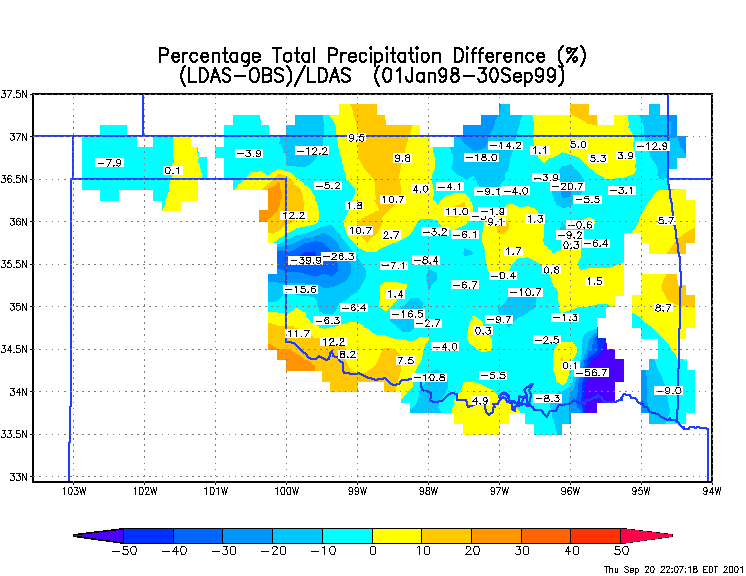
- The percentage difference in total precipitation between LDAS grided and observations reported by Oklahoma Mesonet stations respective to LDAS forcing during the period shown above.
PNG
- The map of percentage difference of total downward shortwave radiation
GIF | EPS
Figures might used for the paper of validation during warm season
- The time series of the spatially average top 10cm soil moisture from all models.
PNG | EPS
- The time series of the spatially average top 10cm soil temperature from all models.
PNG | EPS
- The time series with mean removed of the spatially average top 10cm soil moisture from all models.
PNG | EPS
- Monthly mean diurnal cycle of surface fluxes
GIF
|


