| NOAA Privacy Policy | NWS Disclaimer | ||
|
|
|
|
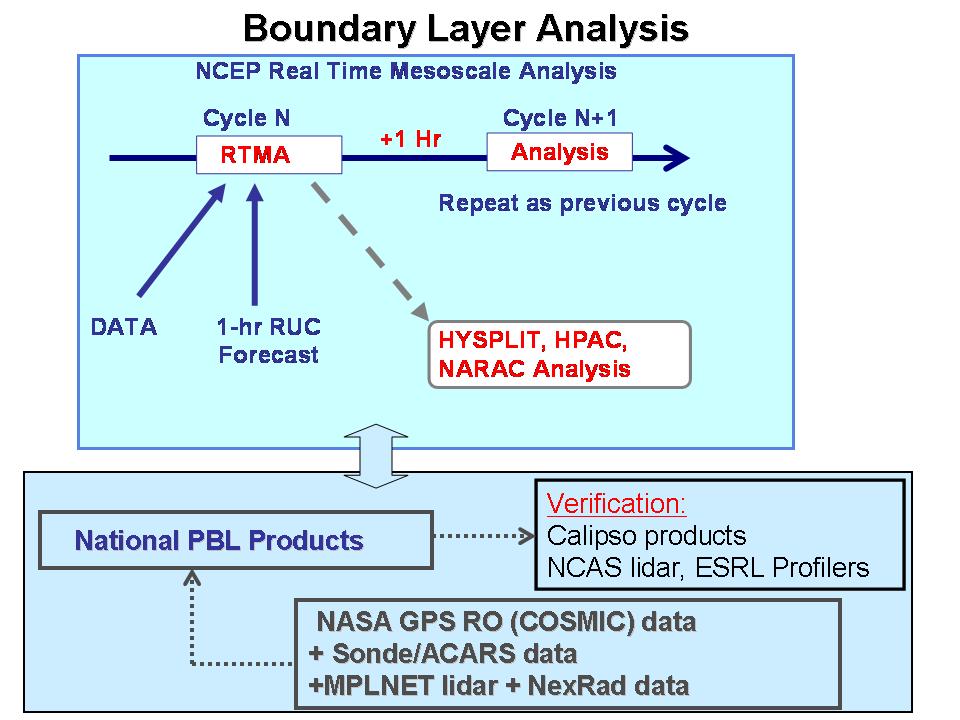
Overview
NOAA
develops decision support systems
to aid homeland security decision makers in the event that harmful
toxic materials are released to the atmosphere. Specifically,
NWS
Forecast Offices and the NWS-NCEP
Hydro-meteorological
Prediction
Center provide dispersion model forecasts driven by NCEP Numerical
Weather Prediction (NWP) models to emergency response managers. In
addition, NCEP NWP predictions are made available to the Department of
Homeland Security Inter-Agency
Modeling and Atmospheric Assessment
Center and the DOD Defense
Threats Reduction Agency to drive their
dispersion models. The atmospheric planetary boundary layer
(PBL)
height is a critical parameter for dispersion decision support
tools.
Accurate assessment of boundary layer information at finer
scales
should improve the Nation’s ability to assess the effects of a
toxic release. 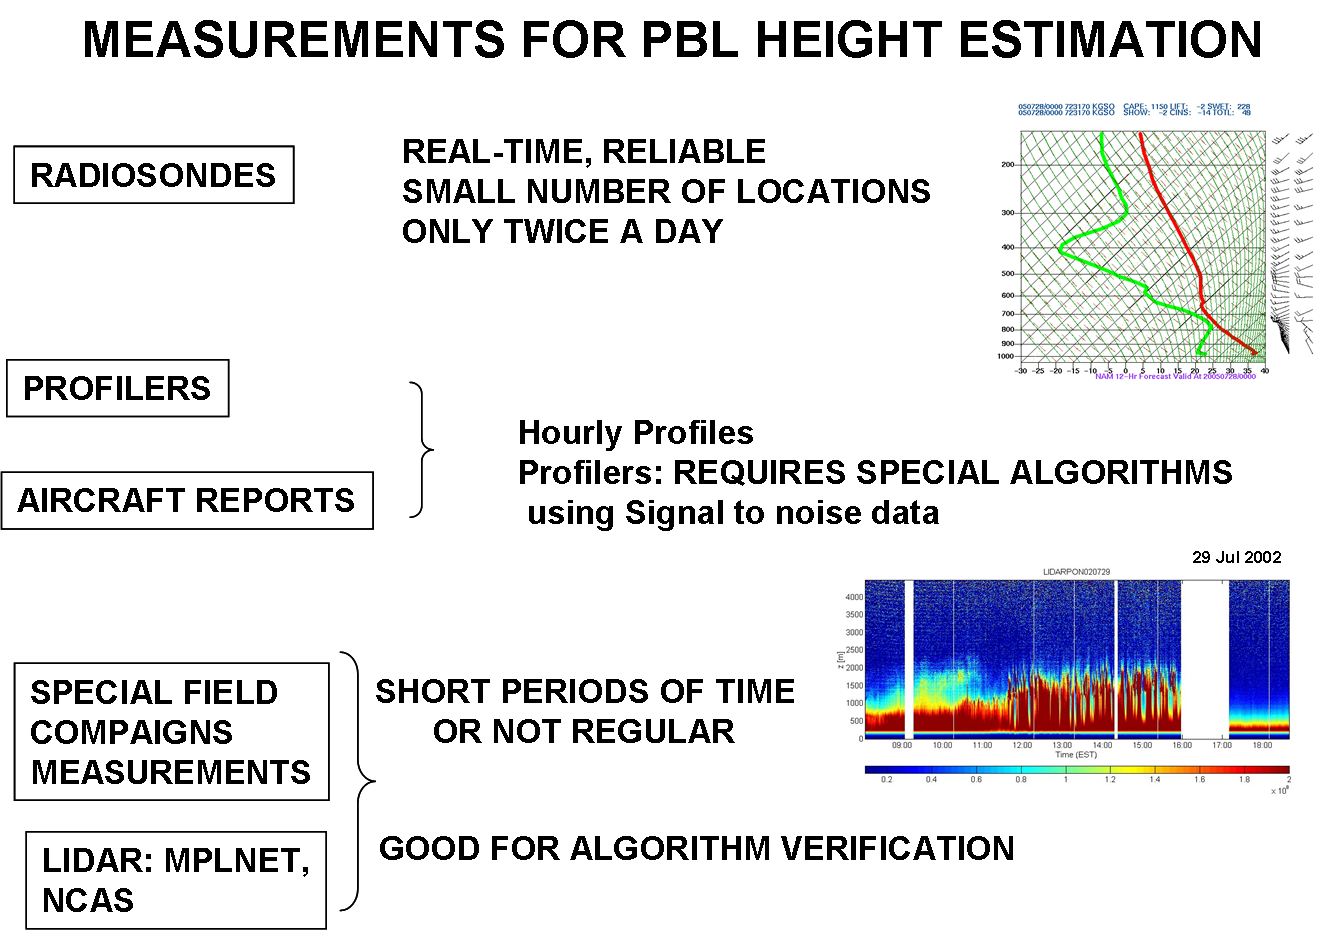 This
project seeks to use recent NASA
satellite technologies and surface based
measurements to demonstrate a
Real-Time
Mesoscale Analysis (RTMA) of PBL information for use by
plume
dispersion modelers.
Specifically, PBL
height products derived from NASA GPS instruments aboard
satellites (COSMIC)
will be assimilated along in
the NCEP
5 km RTMA. Ground based lidar
measurements from the
NASA MPLNET
as well as CALIPSO
will be used to evaluate the
RTMA. NOAA funded Center for Atmospheric Science ( NCAS) and other ground lidars are
leveraged for evaluation.
An
additional dispersion related product, the atmospheric stability, will
be computed using the existing RTMA analyses along with the
PBL
products. The stability analysis can help emergency managers
identify areas conducive for weak dispersion which would be vulnerable
to high toxic pollutant concentrations if a release did
occur.
Table describing instruments, methods and models used to creata a boundary layer analysis
McQueen, J.T., C. Tassone, M. Tsidulko, Y. Zhu, L. Cucurull, S. Liu, G. Manikin and G. DiMego, 2010: Development of a Real-Time Boundary Layer Analysis. Preprints, 16th Conf. Air Poll. Meteor. Jan. 2010. Atlanta, GA. Amer. Meteo. Soc. |
||||||||||||||||||||||||||||||||||||
|
Tasks:
|
||||||||||||||||||||||||||||||||||||
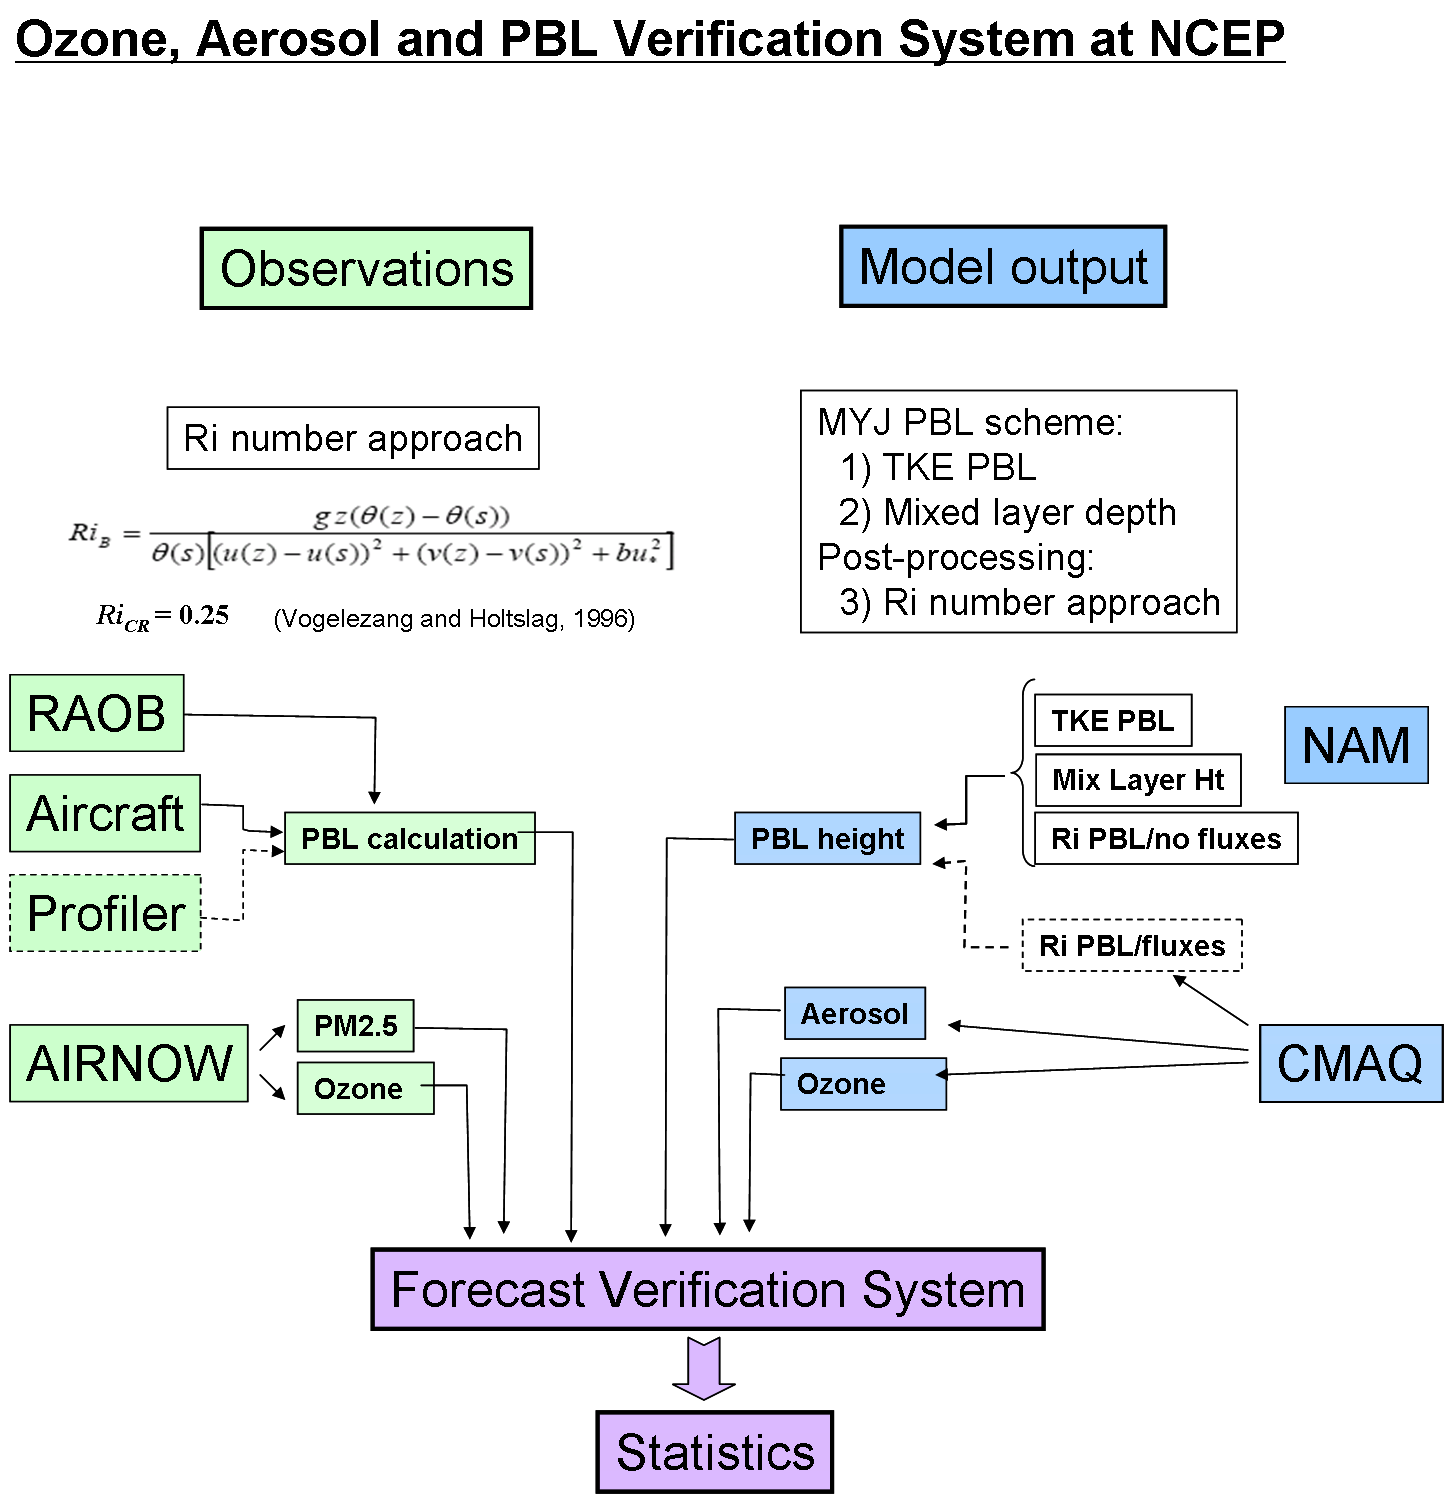 Planetary boundary layer (PBL) depth is an important characteristic in weather forecasting and it is a key parameter in air quality modeling (e.g.: NOAA National Air Quality Forecast Capability) reflecting turbulence and influencing the dispersion for air pollutants. “Observed” PBL depths from radiosonde and aircraft are determined by applying a critical Ri number approach to their profiles as outlined in the flow chart below. The boundary layer products from radiosondes and Meteorological Data Collection and Reporting System (MDCRS/ACARS) aircraft meteorological profiles are now available for model evaluation and assimilation. The outputs are being converted to WMO BUFR format for ingest into the RTMA. Several papers evaluating the NCEP North American Model (NAM) model performance using different techniques to diagnose mixed layer depth during Texas Air Quality study 2006 and for the Summer 2008 are also available. For the first time, the diurnal evolution of model boundary layer performance for many locations around the country can be performed with ACARS pbl heights. Tsidulko, M., J.T. McQueen, G. DiMego and M. Ek, 2008: PBL Verification with Radiosonde and Aircraft Data. American Geophysical Union, Fall Meeting abstract #H31A-0830. Tsidulko, M., G. DiMego, M. Ek, J. McQueen, and P. C. Lee, : PBL and ozone verification in NAM-CMAQ modeling system at NCEP, 9th Conference on Atmospheric Chemistry, San Antonio, TX, 14-18 January, 2007. |
||||||||||||||||||||||||||||||||||||
|
The NASA Micro-Pulse Lidar Network (MPLNET) (Welton et al., 2001) is a federated network of Micro-Pulse Lidar (MPL) systems designed to measure aerosol and cloud vertical structure continuously, day and night, over long time periods required to contribute to climate change studies and provide ground validation for models and satellite sensors in the NASA Earth Observing System (EOS).. 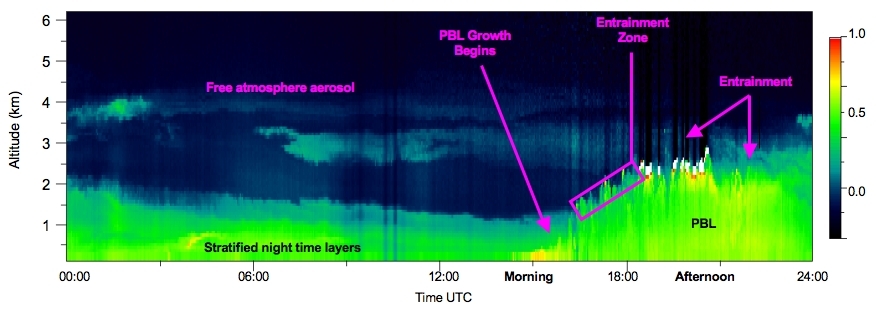 Most MPLNET sites are co-located with sites in the NASA Aerosol Robotic Network (AERONET) (Holben et al., 1998). These joint super sites provide both column and vertically resolved aerosol and cloud data, such as: optical depth, single scatter albedo, size distribution, aerosol and cloud heights, planetary boundary layer (PBL) structure and evolution, and profiles of extinction and backscatter. The figure shows an example of Level 1 lidar profiles from the MPLNET site at NASA Goddard Space Flight Center in Maryland on May 3, 2001. Sunrise occurs around 13:00 UTC, and PBL growth during morning into afternoon is visible in the figure. Aerosol layers in the free troposphere are visible during the previous night, and the PBL eventually reaches high enough to entrain the material in the afternoon. Entrainment of transported material by the local PBL in Maryland will directly impact surface concentration measurements. MPLNET data collect data continuously, day and night. As a result, validation of RTMA PBL heights is possible at all synoptic times. Boundary layer products from MPLNET will be used to evaluate the RTMA boundary layer height analyses. Welton, E. J., J. R. Campbell, J. D. Spinhirne, and V. S. Scott, 2001: Global monitoring of clouds and aerosols using a network of micro-pulse lidar systems, in Lidar Remote Sensing for Industry and Environmental Monitoring, U. N. Singh, T. Itabe, N. Sugimoto, (eds.), Proc. SPIE, 4153, 151-158. |
||||||||||||||||||||||||||||||||||||
|
PBL Heights from NWS Doppler Radars (Shun Liu, Caterina Tassone: NCEP/EMC; Pam Heinselman, Laura Bianco, Dave Stensrud: NOAA/NSSL ) NOAA/OAR/NSSL scientists are estimating PBL depths form wind profiler’s data using three inputs for a Fuzzy Logic based algorithm: vertical profile of the range corrected signal to noise ratio, vertical profile of the variance of the vertical velocity and vertical profile of the spectral width of the vertical velocity (all of them averaged over a period of one hour). Ho 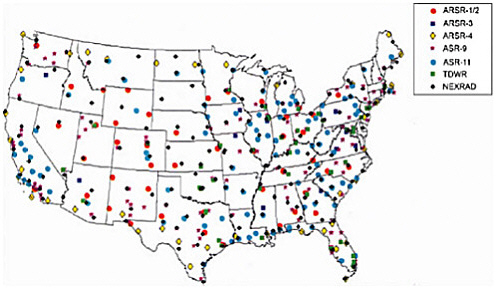 wever,
with NWS NexRad 88D
radars only one input, the vertical profile of
reflectivity is usually available, therefore the Fuzzy Logic algorithm
is simplified. To start, simple membership functions and rules are
used. This simple analysis produced results for 88D that are, in most
of the cases, comparable with those obtained by the wind profiler. wever,
with NWS NexRad 88D
radars only one input, the vertical profile of
reflectivity is usually available, therefore the Fuzzy Logic algorithm
is simplified. To start, simple membership functions and rules are
used. This simple analysis produced results for 88D that are, in most
of the cases, comparable with those obtained by the wind profiler.NSSL and EMC are exploring modified membership functions and rules to improve the agreement before ingesting the hourly estimates from all sites into the RTMA. These diagnosed fields will also be used to evaluate the NAM and RUC boundary layer predictions. Heinselman P.L., Stensrud D.J., Hluchan R.M., Spencer P.L., Burke P.C.,Elmore K.L., (2009): Radar Reflectivity–Based Estimates of Mixed Layer Depth. Journal of Atmospheric and Oceanic Technology 26(2): 229. |
||||||||||||||||||||||||||||||||||||
|
The Howard University Raman Lid 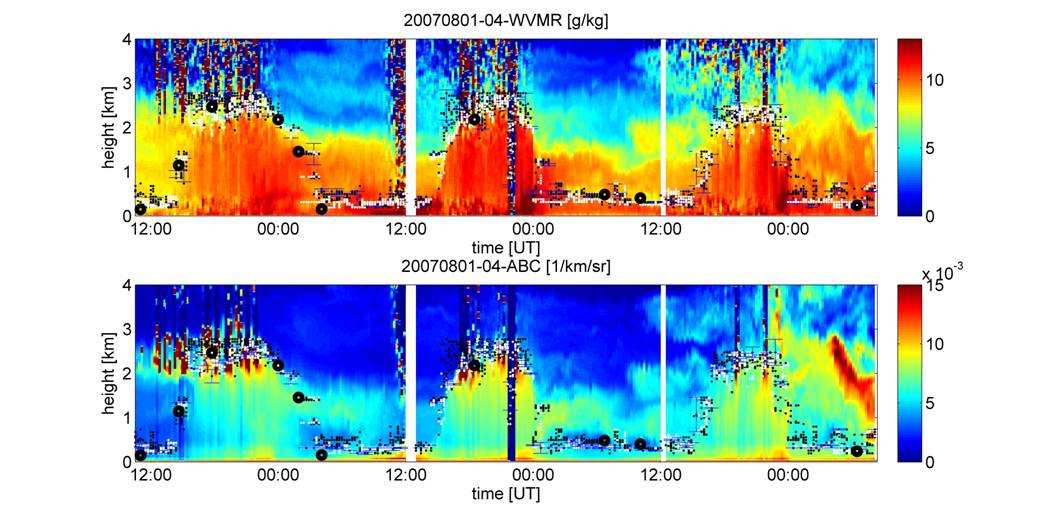 ar
(HURL) system
in Beltsville, MD is designed to make both daytime and nighttime
measurements of atmospheric water vapor and aerosols; the lidar uses
narrow bandpass filters to measure: ar
(HURL) system
in Beltsville, MD is designed to make both daytime and nighttime
measurements of atmospheric water vapor and aerosols; the lidar uses
narrow bandpass filters to measure:1. Rayleigh/Mie and pure rotational Raman signals at 354.7±0.13 nm, 2. Raman scattered photons from nitrogen molecules at 386.7±0.13 nm 3. Raman scattered photons from water vapor molecules at 407.5±0.13 nm The primary purpose of the lidar is to characterize temporal and vertical distributions of water vapor and dynamics processes in the boundary layer for evaluation of mesoscale models. The HURL lidar provides an independent and accurate estimate of boundary layer height to evaluate the RTMA analysis. |
||||||||||||||||||||||||||||||||||||
|
PBL Heights from COSMIC Radio Occultation measurements (Lidia Cucurull, NCEP/JCSDA, Sergey Sokolovskiy and Doug Hunt, UCAR ) 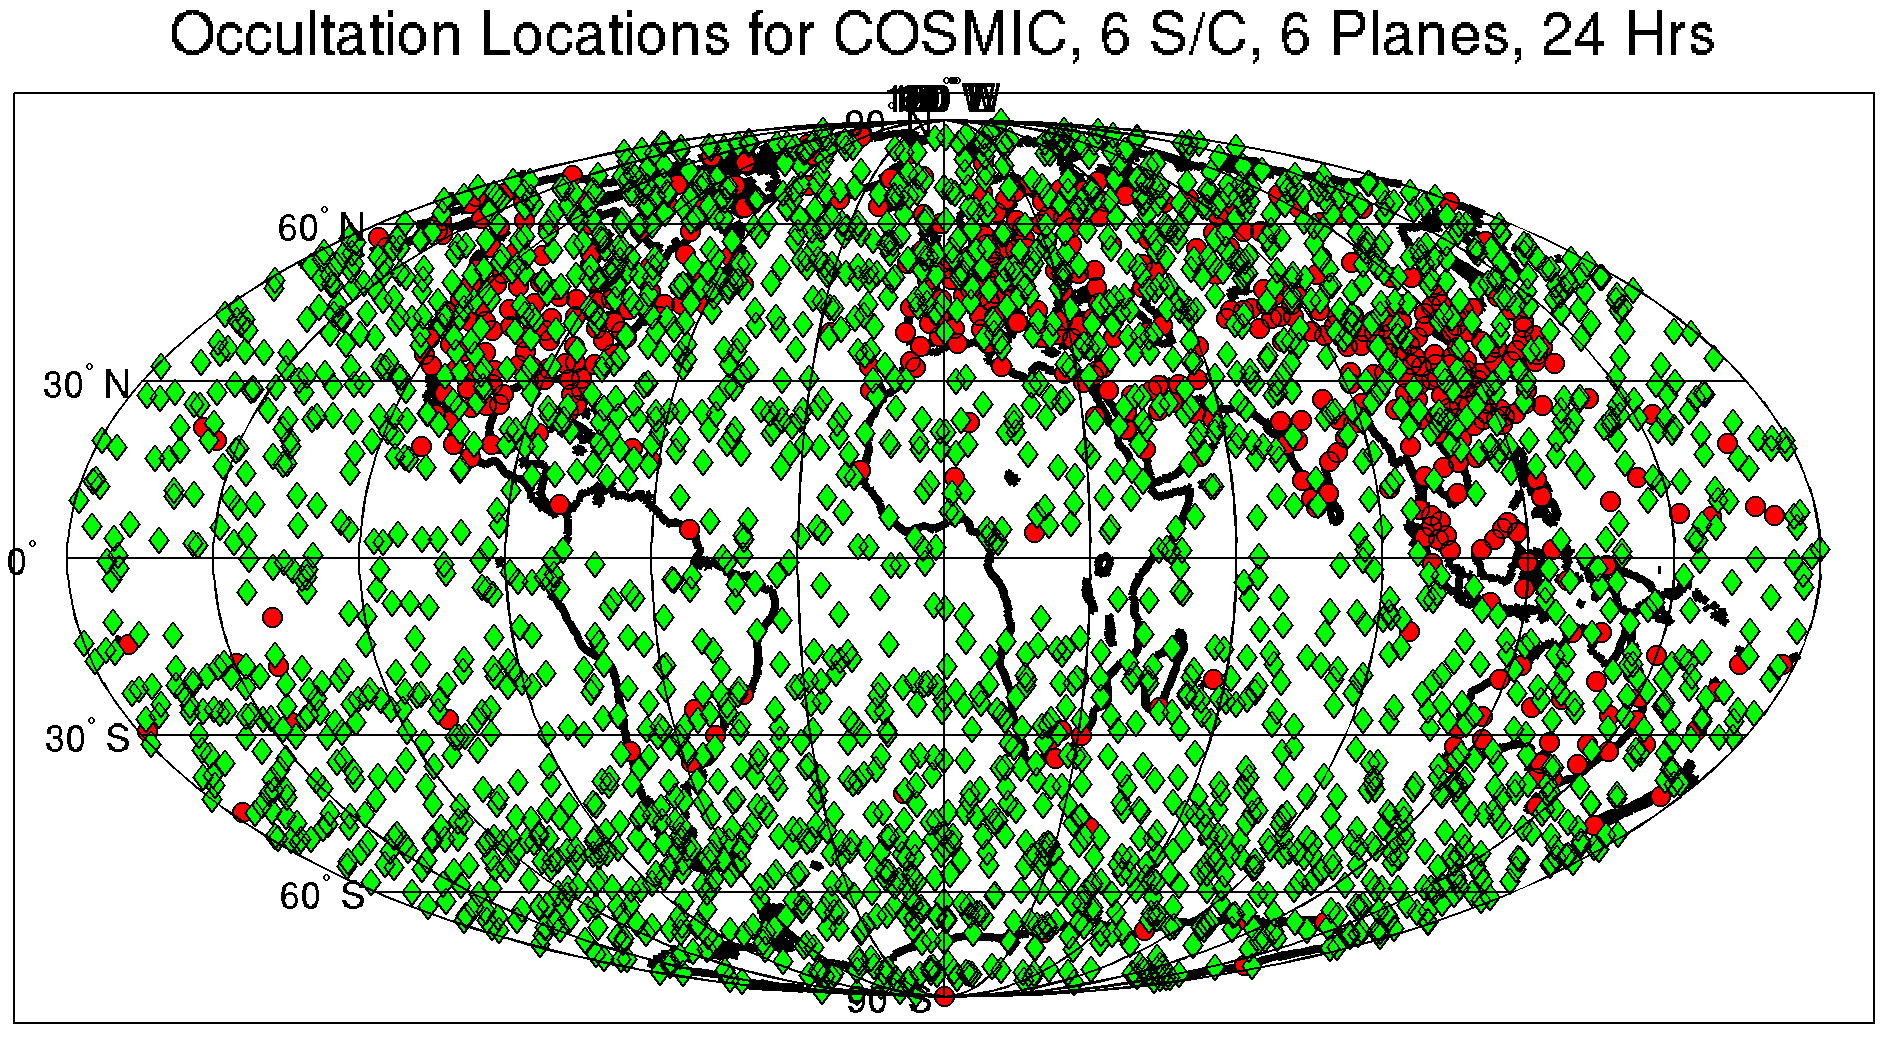 The Constellation Observing System for Meteorology, Ionosphere and Climate (COSMIC/FORMOSAT-3) mission launched six small satellites in April 2006, each carrying a GPS RO receiver. COSMIC is a joint U.S.-Taiwan mission, being NASA one of the sponsors. Each COSMIC GPS RO receiver has been developed by NASA/JPL. At final orbit, COSMIC will provide ~2,500 RO soundings per day uniformly distributed around the globe in near real time. COSMIC GPS RO measurements are characterized by high vertical resolution (from ~100 m in the lower troposphere to ~1km in the lower stratosphere) and lower horizontal resolution (~ 200 km), which will complement the measurements of existing and planned global meteorological satellites. The higher vertical resolution of the GPS RO soundings can be used to estimate the depth of the PBL (Sokolovskiy et al., 2007). Strong vertical moisture gradients in the lower troposphere are manifested as large changes in the bending angle and refractivity profiles. These changes are more significant in the bending angle structures, which suggest the greater utility of the soundings of bending angle than the ones of refractivity to estimate the PBL height. Cucurull, L., J. C. Derber, R. Treadon, and R. J. Purser, 2008: Assimilation of Global Positioning System radio occultation bservations into NCEP’s Global Data Assimilation System, Mon. Wea. Rev., 136, 1865-1877. Sokolovskiy, S. V, C. Rocken, D. H. Lenschow, Y.-H. Kuo, R. A. Anthes, W.S. Schreiner, and D.C. Hunt, 2007: Observing the moist troposphere with radio occultation signals from COSMIC, Geoph. Res. Lett., 34, L18802, doi:10.1029/2007GL030458. |
||||||||||||||||||||||||||||||||||||
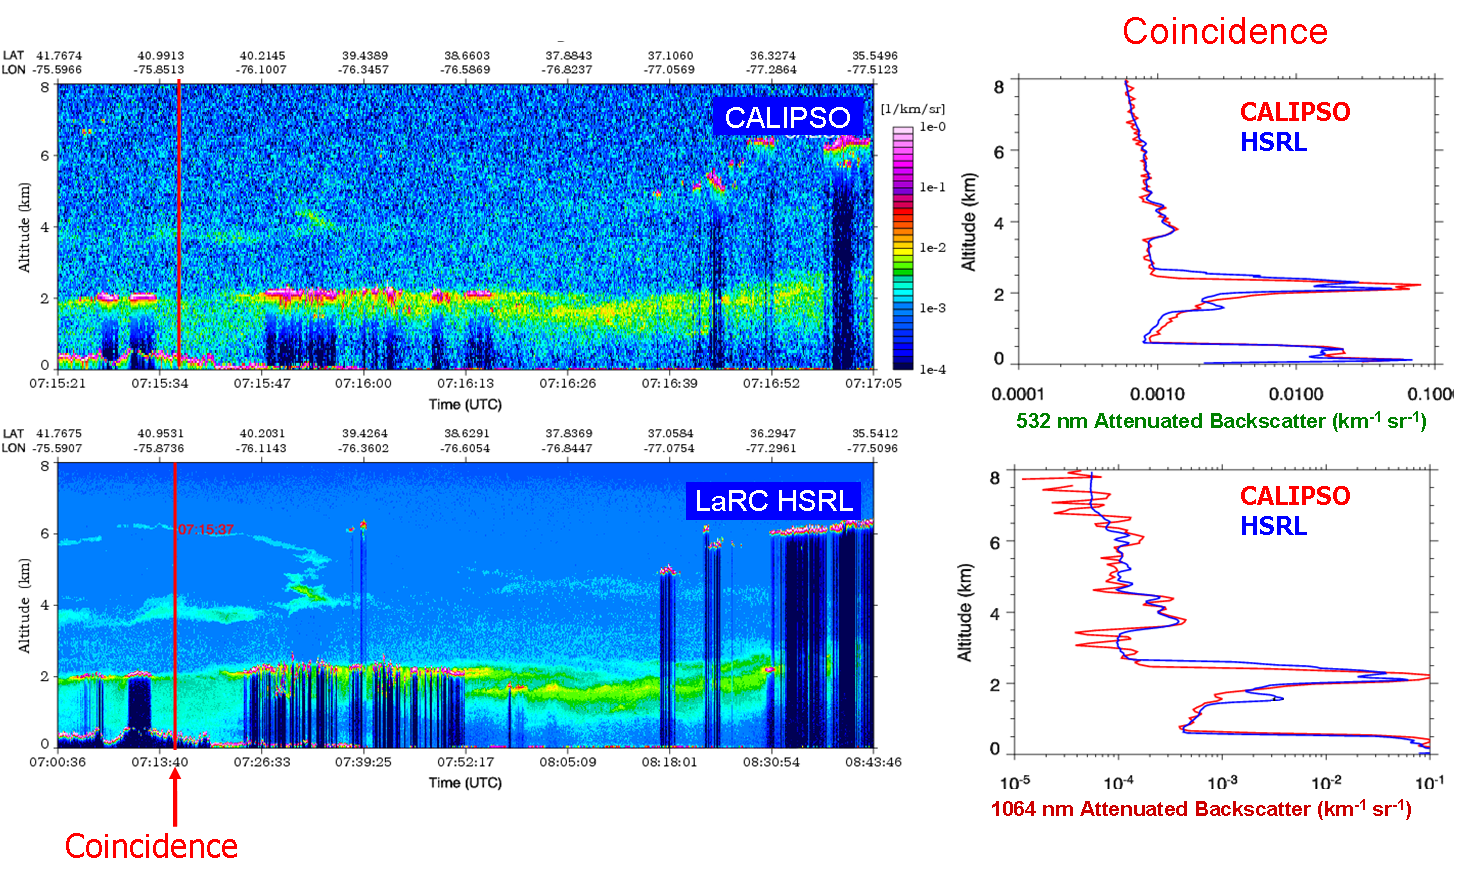 The
Cloud-Aerosol Lidar and Infrared Pathfinder Satellite
Observations -
CALIPSO (Winker et al. 2002), launched last year and data is
available
from June 2006. CALIPSO contains a dual wavelength depolarization
backscatter lidar (CALIOP) that provides profiles of attenuated
backscatter from the surface through the stratosphere at 532 nm and
1064 nm wavelengths. Aerosol and cloud height products are available,
which can be used to infer PBL height. The
Cloud-Aerosol Lidar and Infrared Pathfinder Satellite
Observations -
CALIPSO (Winker et al. 2002), launched last year and data is
available
from June 2006. CALIPSO contains a dual wavelength depolarization
backscatter lidar (CALIOP) that provides profiles of attenuated
backscatter from the surface through the stratosphere at 532 nm and
1064 nm wavelengths. Aerosol and cloud height products are available,
which can be used to infer PBL height.The ultimate goal at NCEP is the utilization of CALIPSO radiances in a full-up version of NCEP’s RTMA system, with the derivation PBL fields in addition to the products currently used in the meteorological analysis. Any environmental data assimilation system starts with a prognostic capability. The coupling with RTMA enables NCEP to improve NAM first guess boundary layer forecasts. CALIPSO measurements will be incorporated into NOAA operational use by providing a near real-time verification of RTMA and NAM predictions. The impact of assimilated CALIPSO derived PBL products and radiance measurements to constrain and calibrate the RTMA will be demonstrated. Winker, D. M., J. R. Pelon, and M. P. McCormick, 2002: The CALIPSO mission: spaceborne lidar for observation of aerosols and clouds. in Lidar Remote Sensing for Industry and Environmental Monitoring III, U. N. Singh, T. Itabe, Z. Liu, (eds.), Proc. SPIE, 4893, 1-11. |
||||||||||||||||||||||||||||||||||||
 The NCEP Forecast
Verification System (FVS) was extended to evaluate
PBL
heights from predictions from the WRF-NMM
Mellor-Yamada-Janjic (MYJ)
TKE
parameterization and the Rapid Update Cycle (RUC) Burk-Thompson TKE scheme.
Additional algorithms relying on critical Richardson number
were
added to WRF to estimate PBL height. These
additional algorithms were also evaluated using the FVS and
agreement with radiosondes and profilers was improved. The NCEP Forecast
Verification System (FVS) was extended to evaluate
PBL
heights from predictions from the WRF-NMM
Mellor-Yamada-Janjic (MYJ)
TKE
parameterization and the Rapid Update Cycle (RUC) Burk-Thompson TKE scheme.
Additional algorithms relying on critical Richardson number
were
added to WRF to estimate PBL height. These
additional algorithms were also evaluated using the FVS and
agreement with radiosondes and profilers was improved.
Web links:
Tsidulko,M., J. T. McQueen, G. DiMego, M. Ek and L. Cucurull, 2008: PBL Verification with Radiosonde, Aircraft and Cosmic Data. 12th Annual George Mason University Conference on “Atmospheric Transport and Dispersion Modeling”, Fairfax, VA. July 8-10, 2008. Tsidulko, M., G. Dimego, M. Ek, J. McQueen, and P. C. Lee, 2007: PBL and ozone verification in NAM-CMAQ modeling system at NCEP, 9th Conference on Atmospheric Chemistry, San Antonio, TX, 14-18 January, 2007. |
||||||||||||||||||||||||||||||||||||
|
Assimilation into the 2-D Variational Real Time Mesoscale Analysis: RTMA (Yanqui Zhu, John Derber, Geoff DiMego; NCEP/EMC) Two components of the Real-Time Mesoscale Analysis (RTMA) are run in the NCEP production suite on the NOAA Central Computer System (CCS). These two components of the RTMA system are developed and supported by the Environmental Modeling Center (EMC) and operated and managed by NCEP Central Operations (NCO). RTMA products were introduced on the National Weather Service’s Advanced Weather Information Processing System (AWIPS) in 2006. The RTMA suite of analyses comes from three sources with two running at NCEP. An Effective Cloud Amount (ECA) is produced from GOES data at and by NOAA/NESDIS. An hourly analysis of gage observations and radar estimates of precipitation accumulation over the contiguous United States (CONUS) is produced at NCEP and is called the Stage II National Precipitation Analysis. For the RTMA, this analysis is converted and interpolated to the 5 km NWS National Digital Forecast Database (NDFD grid) used by all NWS Forecast offices to produce gridded forecast products. 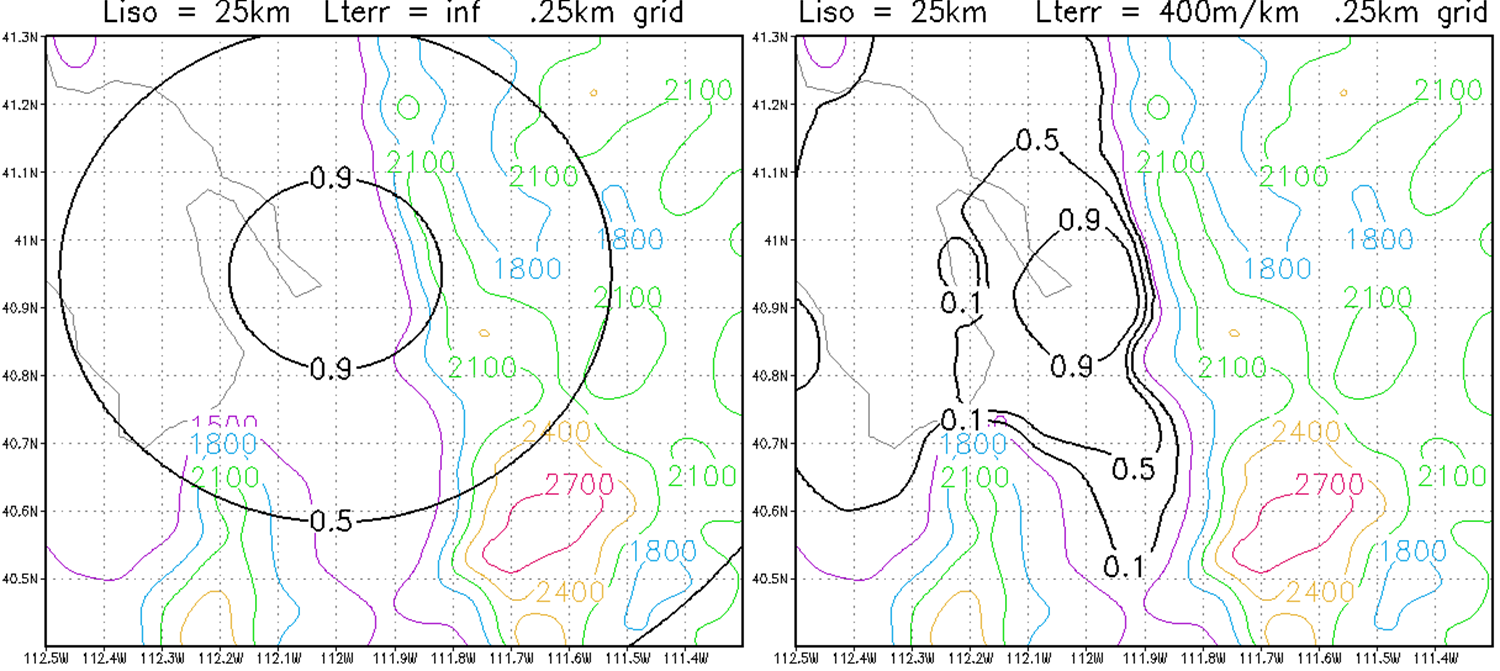 The primary RTMA system component, is based on a 2-dimensional application of EMC’s unified 3-dimensional variational analysis system called Grid-point Statistical Interpolation (GSI). The GSI runs in both the North American Mesoscale (NAM & NDAS) and Global Forecast System (GFS & GDAS). Using a first-guess obtained by downscaling a 1-hour Rapid Update Cycle (RUC) forecast from 13- to 5-km, the RTMA performs an analysis of all surface observations (surface-synoptic, metar, mesonet, ship, buoy etc) of temperature anddew point at 2 m and wind at 10 m. In addition, estimates of analysis uncertainty for each variable are also produced. Reducing the assimilation process to two dimensions enables the development of high resolution analysis in real-time for various forecaster applications. A high horizontal resolution analysis is essential for dispersion and air quality applications which are very sensitive to fine scale boundary layer processes driven by fine scale orogrophy such as land-sea breezes, flows in complex terrain and urban heat island effects. 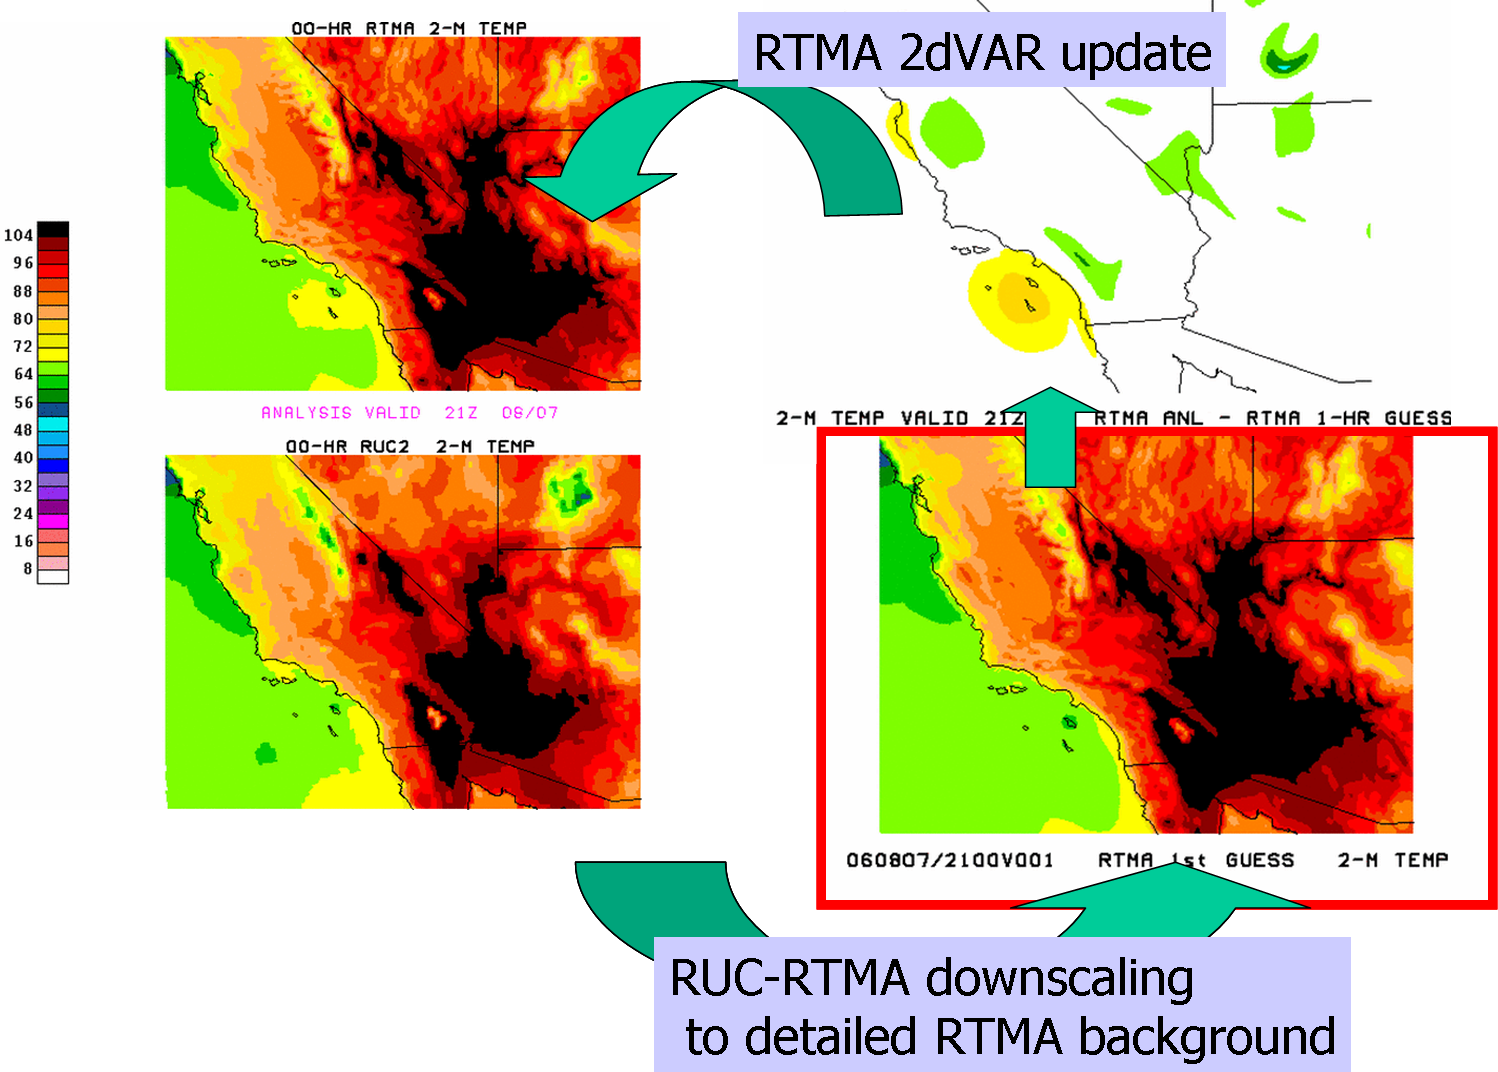 Benjamin, S. , J.M. Brown, G. Manikin and G. Mann, 2007: The RTMA Background - Downscaling of RUC data to 5 km Detail. P1.11, 23rd IIPS, January, 2007, San Antonio, TX, Amer. Meteo. Soc. Pondeca, M. and G.S. Manikin, 2009: Recent improvements to the Real-Time Mesoscale Analysis (RTMA). 23rd Conf. Wea. Anal. and Forec/19th Conf. Numer. Wea. Pred. Omaha, NE, June, 2009, Amer. Meteo. Soc. Zhu, Y., G. DiMego, J. Derber, M. Pondeca, G. Manikin, R. Treadon, D. Parrish, and J. Purser, 2009: Wind Gust Speed Analysis in RTMA, 23rd Conf. Wea. Anal. and Forec/19th Conf. Numer. Wea. Pred. Omaha, NE, June, 2009, Amer. Meteo. Soc. |
||||||||||||||||||||||||||||||||||||
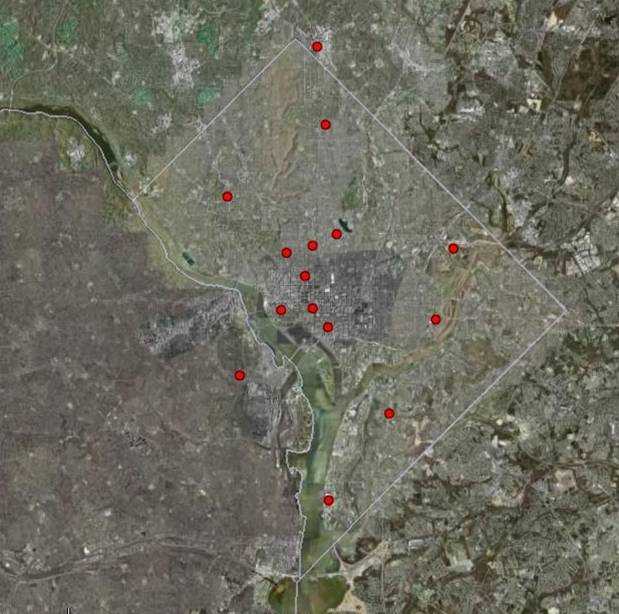 Mesonets not directly assimilated into the RTMA serve as an independent dataset for analysis evaluation of surface winds and temperatures. These fields are in turn used to derive boundary layer products such as atmospheric stability. The NOAA/ARL Atmospheric Turbulence and Diffusion Laboratory (ATDD) is developing web based data viewing capabilities to more easily analyze the RTMA perfomance. It is expected that diagnosed and modeled boundary layer depth will be added to the viewer for emergency response decision makers and atmospheric modelers. For real-time wind and temperature comparison, see: http://dataviewer.atdd.noaa.gov/rtmacomparison/ The RTMA existing temperature, humidity, winds and cloud cover analyses will be combined with the PBL products to enable the generation of a high resolution atmospheric turbulence and stability analysis based upon the works of F. Pasquill and F. A. Gifford. The Pasquill –Gifford (P-G) stability classification scheme provides a first order estimate on whether the atmosphere is relatively turbulent, convective or unstable and conditions where less turbulence and a more stable atmosphere exists. The P-G stability class is used by simple 2-dimensional plume dispersion models which can have a large effect on the predicted or analyzed plume footprint or concentration amount. Under unstable conditions, for example, a dispersing gas will mix rapidly with the air around it. The plume cloud will extend less far downwind than it would under more stable conditions, because the pollutant would more be diluted faster. Therefore, this project will provide a high resolution stability analysis for use by emergency managers to assess atmospheric potential for plume dispersion. A focus group of NWS forecasters and emergency managers will be assembled to help evaluate the usefulness of this new product for their homeland security missions. Hourly analyses of the following 2.5 km PBL products are expected from this project: |
||||||||||||||||||||||||||||||||||||
|
PBL analyses to drive dispersion models (Roland Draxler, NOAA/ARL; Kyle Dedrick, DOD/DTRA; Matt Simpson, DHS/IMAAC) The NOAA/A 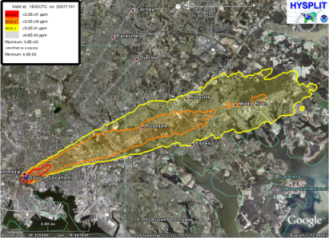 RL HYSPLIT
(HYbrid Single-Particle Lagrangian Integrated Trajectory)
model is the
newest version of a complete system for computing simple air parcel
trajectories to complex dispersion and deposition simulations. It is
the primary NOAA decision support tool for plume dispersion and RSMC
support. The dispersion of a pollutant is calculated by
assuming
either puff or particle dispersion. RL HYSPLIT
(HYbrid Single-Particle Lagrangian Integrated Trajectory)
model is the
newest version of a complete system for computing simple air parcel
trajectories to complex dispersion and deposition simulations. It is
the primary NOAA decision support tool for plume dispersion and RSMC
support. The dispersion of a pollutant is calculated by
assuming
either puff or particle dispersion.This project will evaluate the use of improved NAM and RTMA boundary layer analyses and forecasts on HYSPLIT plume dispersion forecasts. HYSPLIT wild fire smoke forecasts with the enhanced products will be compared to observed smoke products from NOAA and NASA smoke aerosol optical depth smoke products already used operationally at NCEP. In addition, these products will be available to the DOD DTRA Hazards Prediction and Assessment Capability (HPAC) and the IMAAC NARAC dispersion modeling groups to evaluate their model impact with the downscaled analyses. McQueen, J.T., D. Jovic, H. Chuang, B. Zhou, J. Du, M. Tsidulko and Geoff DiMego, 2007: An Overview of the NOAA National Centers for Environmnental Prediction (NCEP) meteorological model products to support atmospheric transport and dispersion studies. 18th Conf. on Numerical Weather Prediction, 24-29 June, Park City, UT. 3B.7, Amer. Meteor. Soc. McQueen, J.T., D. Jovic, H. Chuang, B. Zhou, J. Du, S.G. Gopalakrishnam, M. Tsidulko, Z. Janjic, Z. Toth and Geoff DiMego, 2007: An Overview of the NOAA National Centers for Environmnental Prediction (NCEP) meteorological model products and their application for atmospheric transport and dispersion studies. The Conference for Chemical and Biological Information Systems, JSTO, Jan.8-12, 2007, Austin, TX. |
NCEP | National Weather Service | NOAA | Department of Commerce |