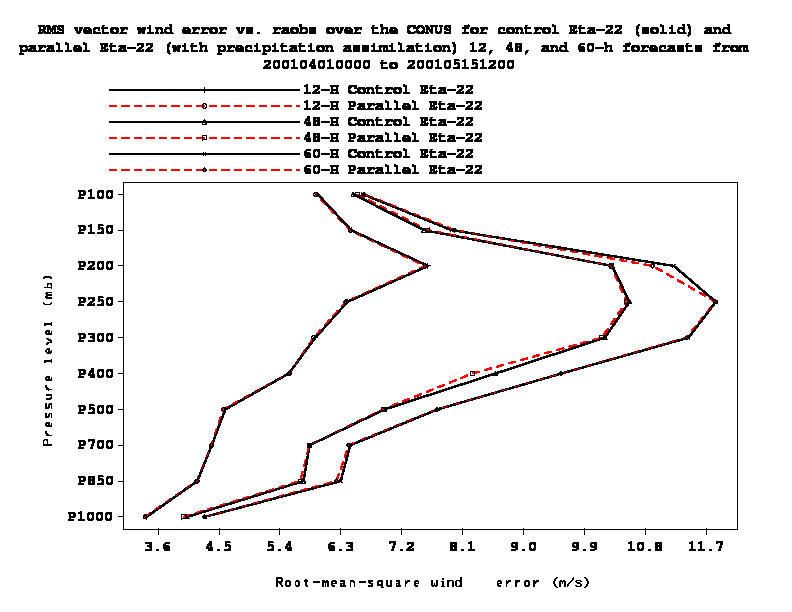
Figure 5: RMS vector wind errors for Eta 12, 48, and 60-h forecasts from the 22km control run (black solid lines) and the precipitation assimilation run (red dashed line), 1 April - 15 May 2001