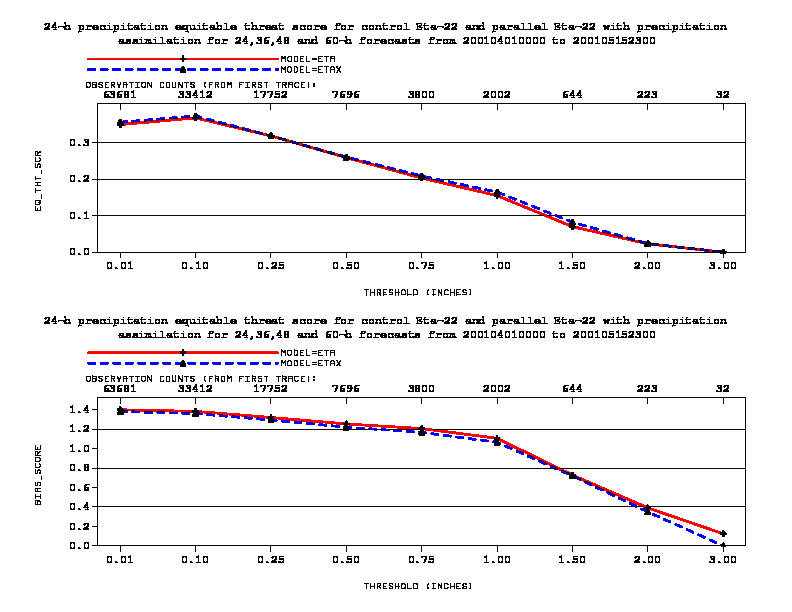
Figure 4: Equitable threat and bias scores for Eta 24, 36, 48, and 60-h precipitation forecasts, for the 22-km control run (red solid lines) and the precipitation assimilation run (blue dashed lines), 1 April - 15 May 2001