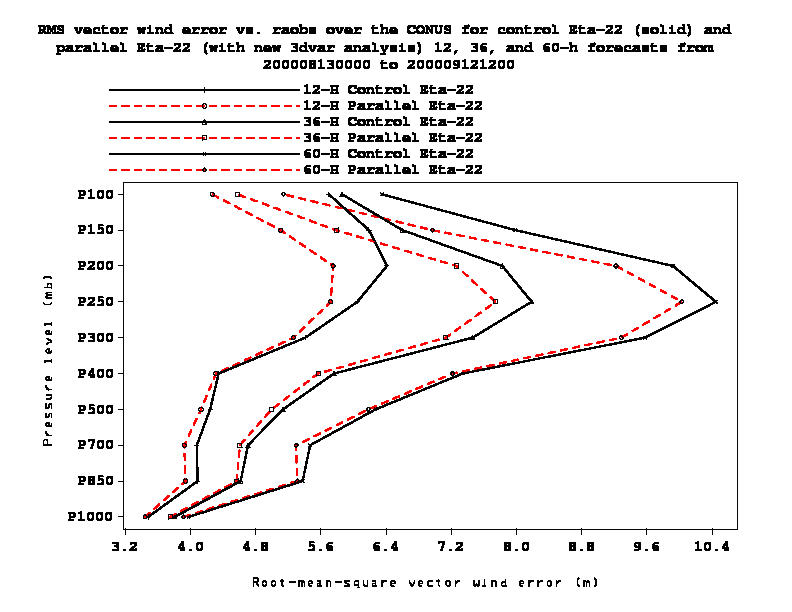
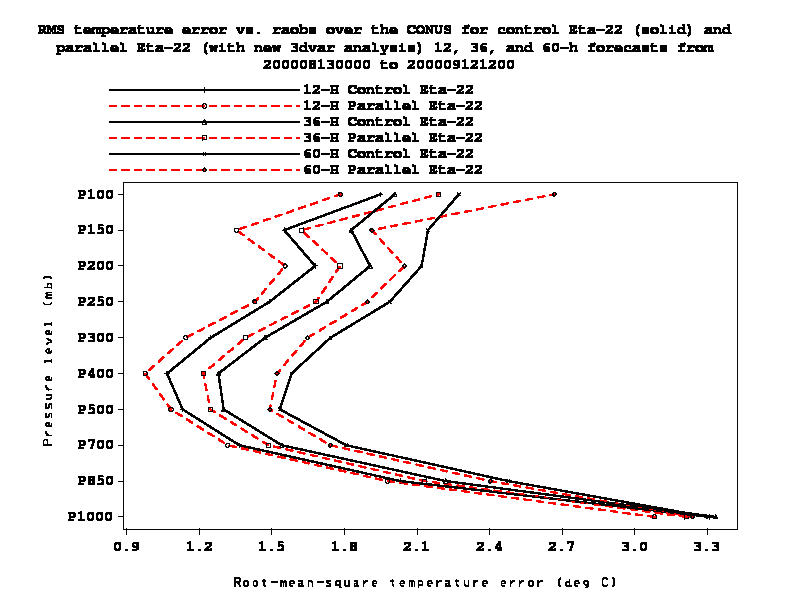
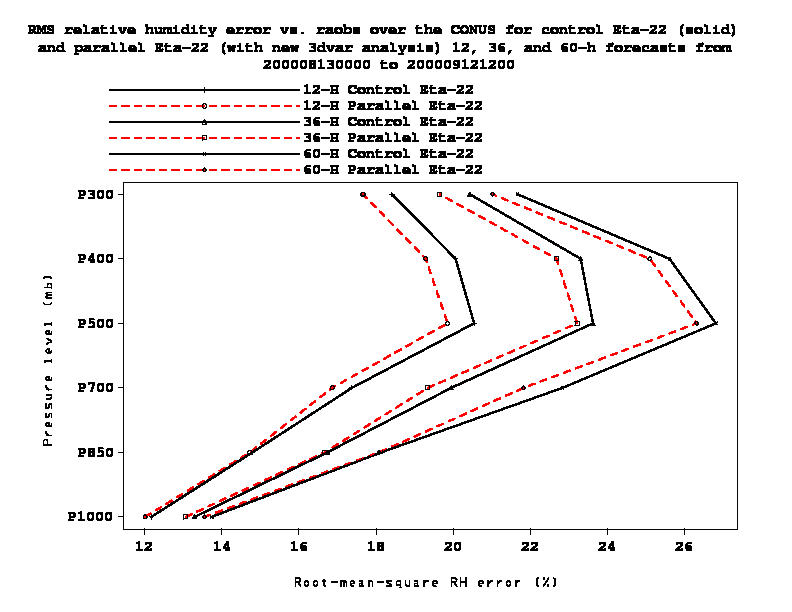
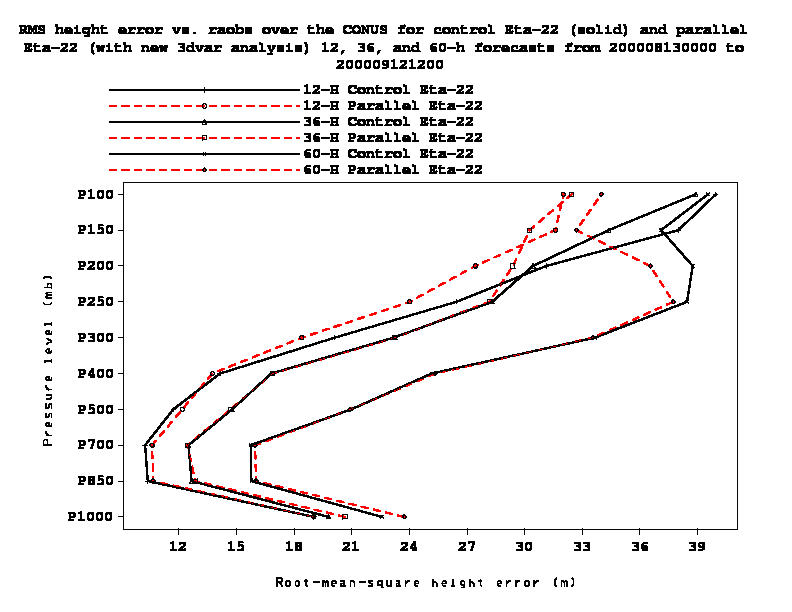
Figure 25: Average root-mean-square errors versus rawinsondes over the CONUS
from the control Eta-22 (solid black) and the parallel Eta-22 with the new
3DVAR analysis (dashed red) 12,36,60-h forecasts from 12Z 13 August 2000 - 12Z 12 September
2000. Top left = vector wind error (m/s); top right = temperature error (deg C);
bottom left = realtive humidity (%); bottom right = height (m)