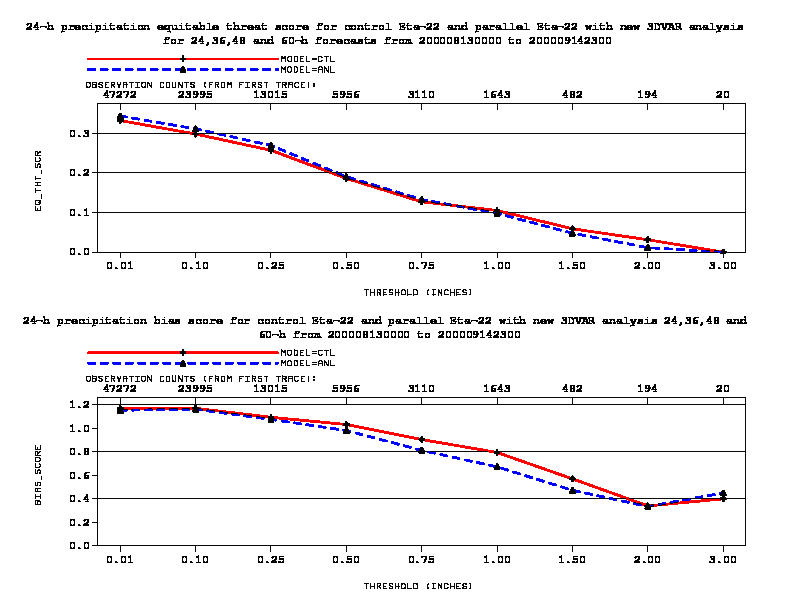
Figure 23: (Left) Equitable threat (top) and bias (bottom) scores for 24-h accumulated
precipitation from the control Eta-22 (solid red) and the parallel Eta-22 with the new
3DVAR analysis (dashed blue) 24,36,48,60-h forecasts from 12Z 2 February 2001 - 12Z 1 March
2001. (Right) Same as left panel, but for the period 12Z 13 August 2000 - 12Z 12 Sepetmber 2000