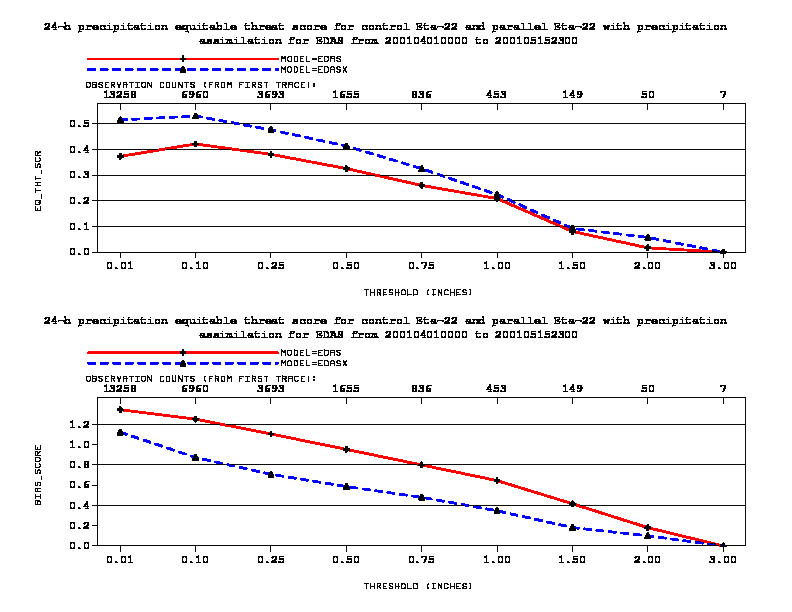
Figure 2: Equitable threat and bias scores for EDAS precipitation, for the 22-km control run (red solid lines) and the precipitation assimilation run (blue dashed lines), 1 April - 15 May 2001