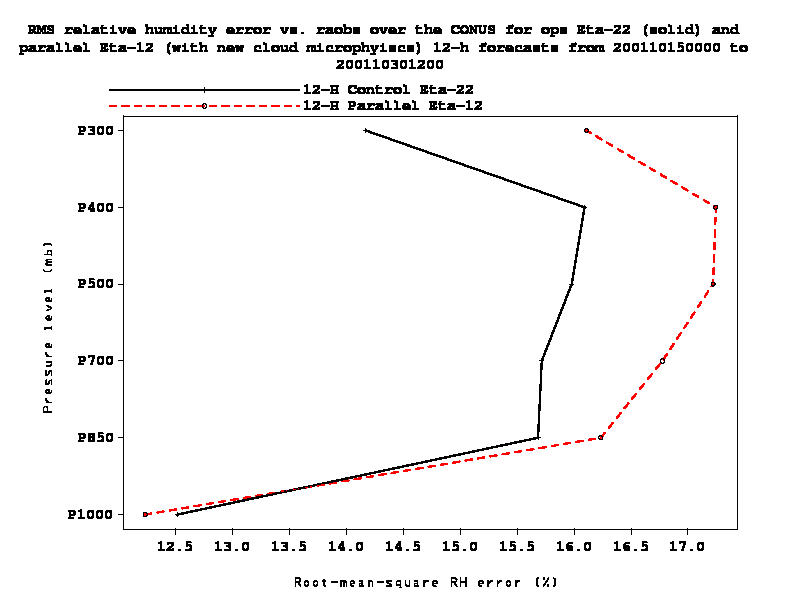
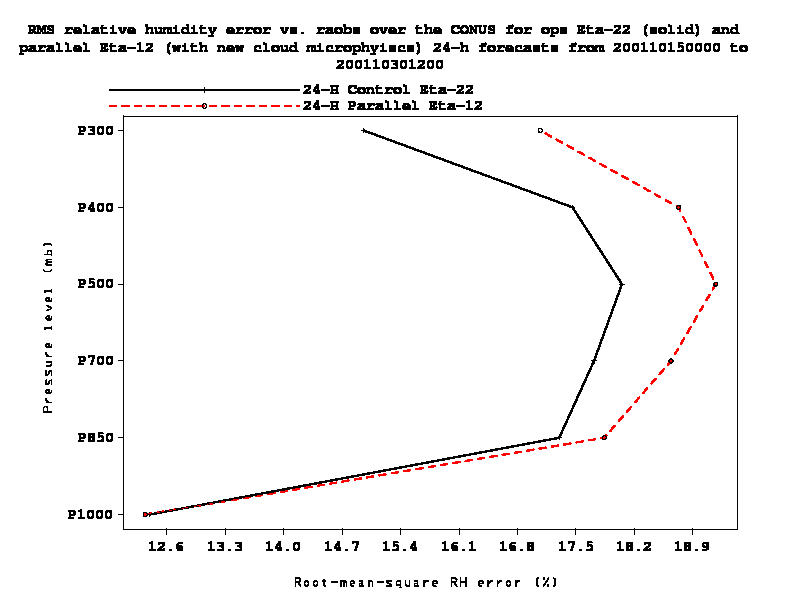
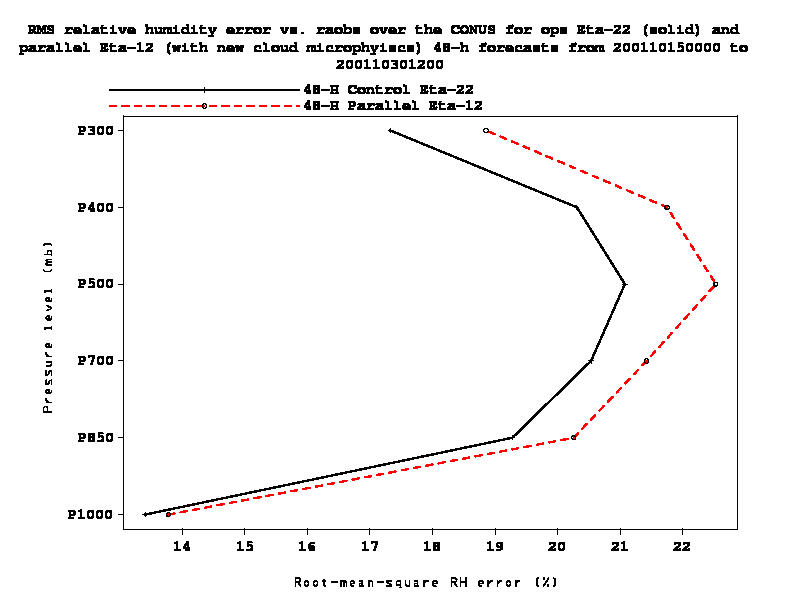
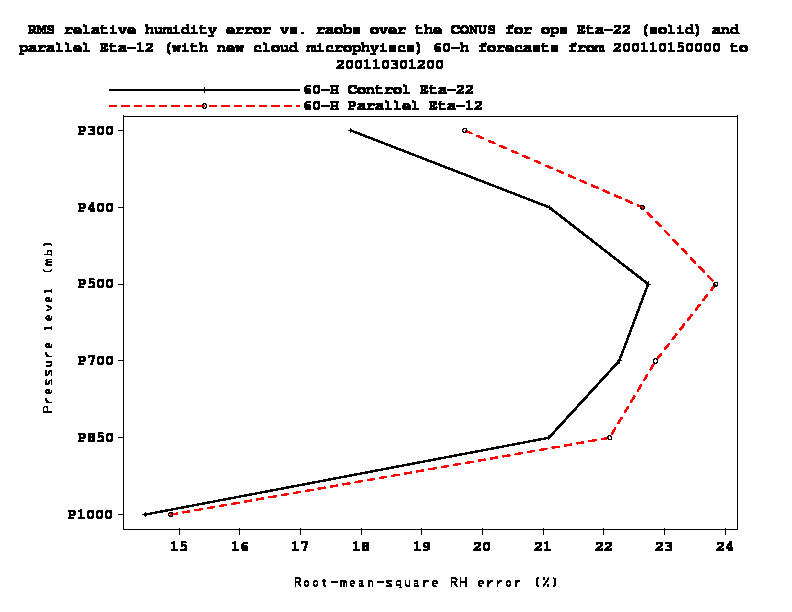
Figure 6.5: Vertical distribution of relative humidity root-mean-square
errors (%) versus rawinsondes over the CONUS for the operational Eta-22 (solid black) and
the Eta-12 with the new cloud microphysics (dashed red) for the period 15-30
October 2001 for all 12-h forecasts (top left); 24-h forecasts (top right);
48-h forecasts (bottom left); and 60-h forecasts (bottom right).