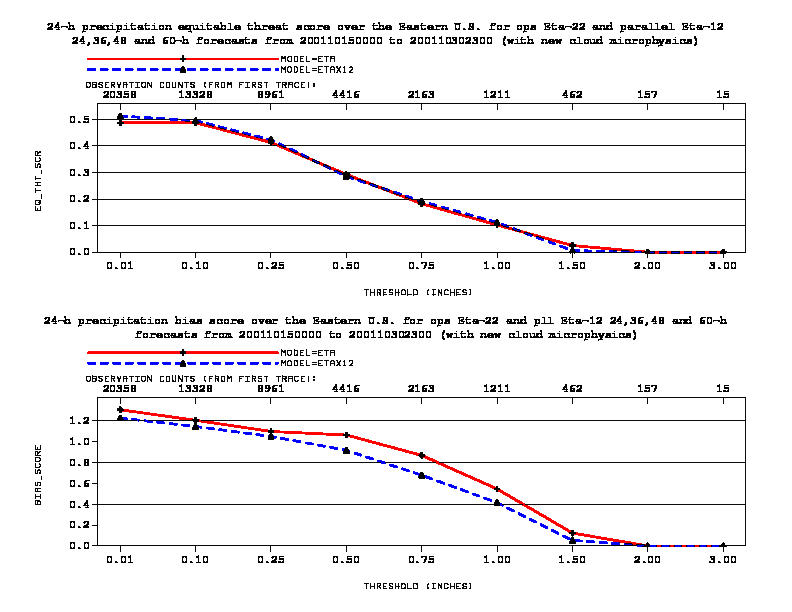
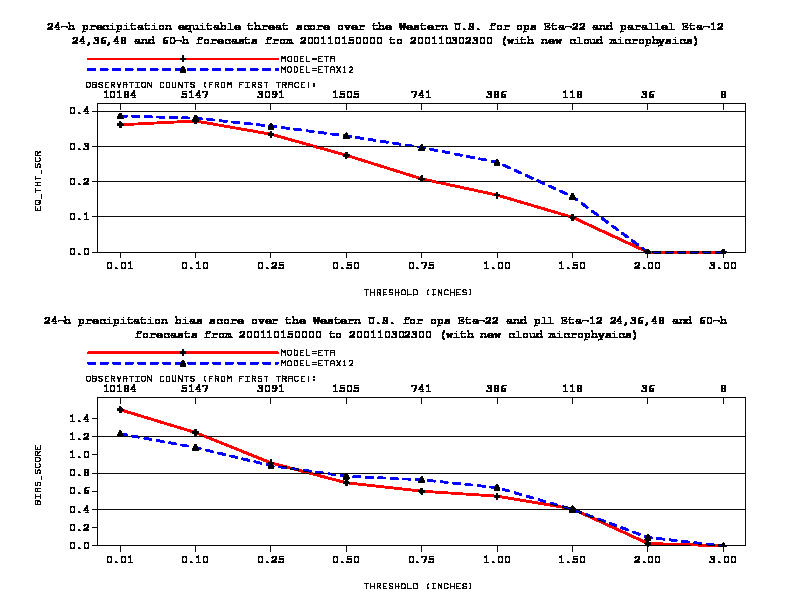
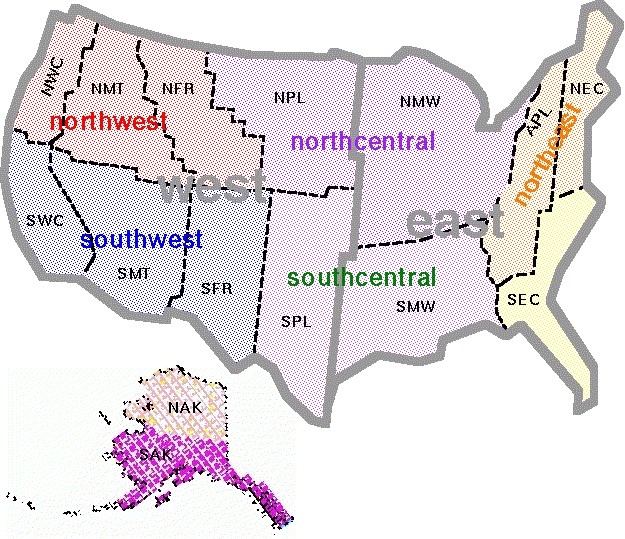
Figure 6.2: Same as Figure 6.1, but for the Eastern U.S (top left) and the Western U.S. (top right). The map on the lower right shows the regions covered in the Eastern and Western U.S. used to compute the regional precipitation statistics.