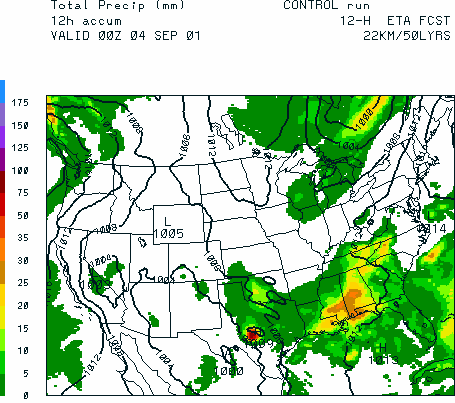
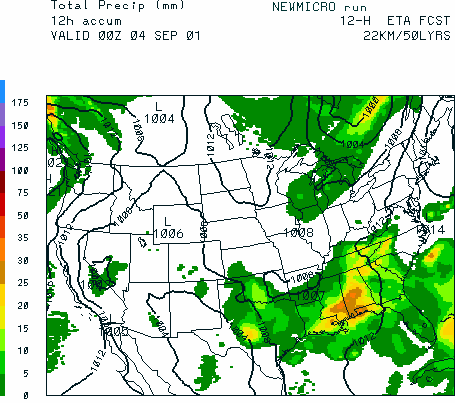
Figure 3.9(a) 12-h accumulated precipitation (mm) and surface pressure (mb)
valid at 00Z 4 September 2001 for runs using the 22-km Eta runs are shown for the
operational control (left) and the new grid-scale microphysics (right). A strong
local maximum in precipitation is predicted in the control run, together with a
considerable amount of noise in the surface pressure field.
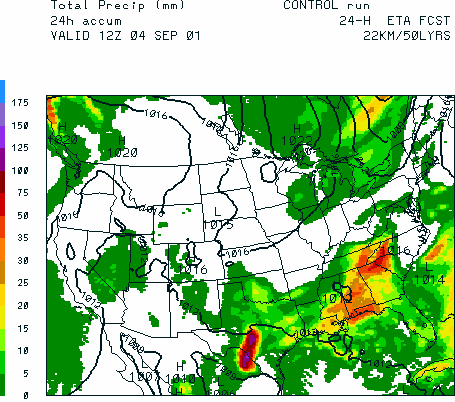
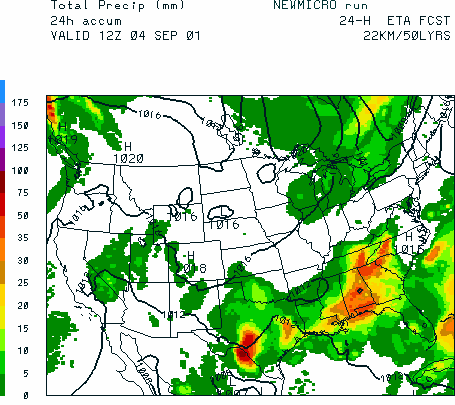
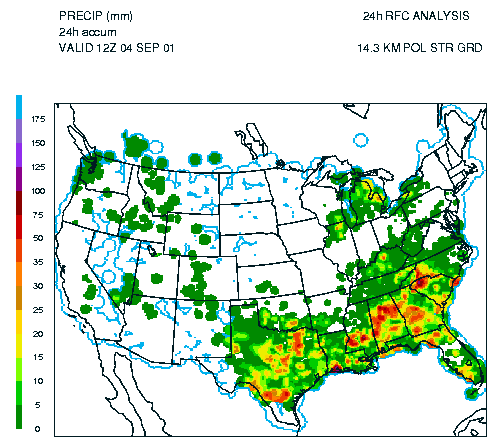
Figure 3.9(b) 24-h total precipitation (mm) and surface pressure from the
operational control (left) and the new grid-scale microphysics (center) are compared
with the 24-h total rainfall from the RFC analysis (right) valid at 12Z 4 September
2001. Similar to the forecasts from the 10-km central nest, the operational control
run produced too much rainfall over southwestern Texas, most of which was from the
grid-scale parameterization.
