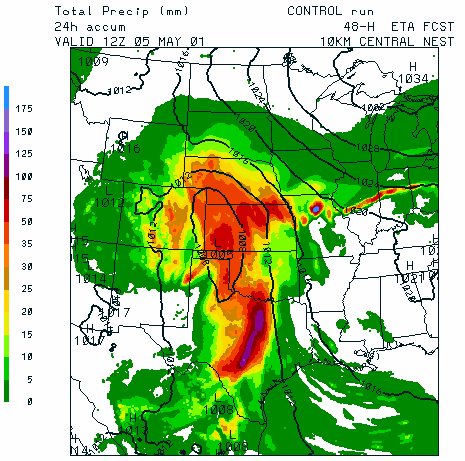
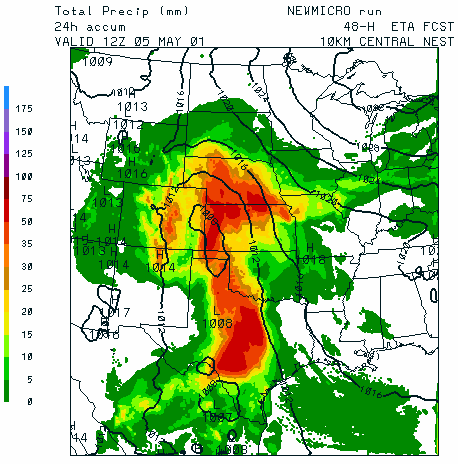
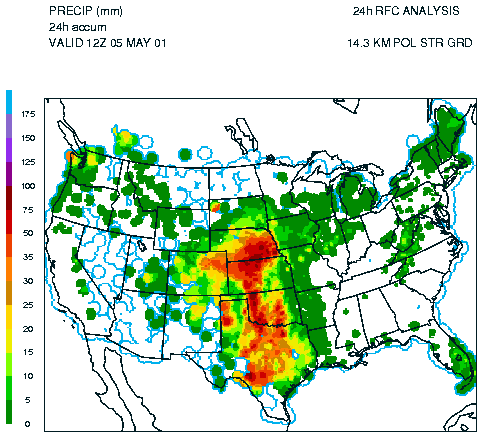
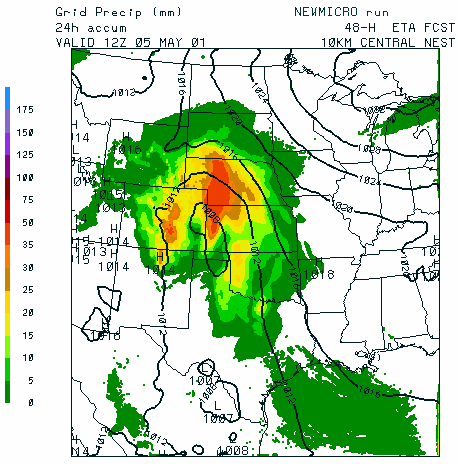
Figure 3.6(a) 24-h accumulated precipitation (mm) and surface pressure (mb)
from the Eta 10-km central nest runs are shown using the operational control (left)
and the new grid-scale microphysics (center). These 48-h forecasts can be compared
with the 24-h accumulated rainfall from the RFC analysis valid at 12Z on 5 May 2001
(right). Note the spurious local maxima in precipitation over northern Missouri and
along a concentrated line through central Illinois and Indiana in the control run
(left), which is not present in the run using the new microphysics (center) nor in
the verification (right). Too much rainfall was also predicted over central Texas
in the operational control.
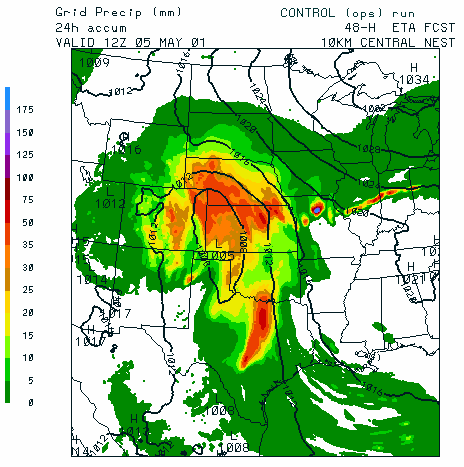
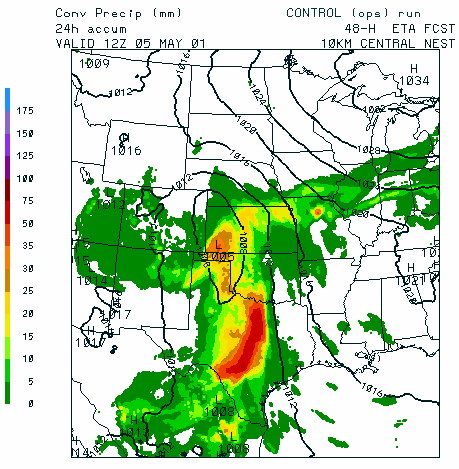
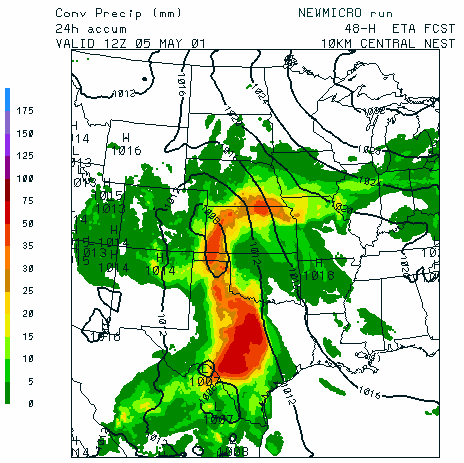
Figure 3.6(b) Same as in (a), except that the contribution from the grid-scale
precipitation is shown for the operational control (left) and the new microphysics
(right). The spurious bulls eyes in the control run was due to grid-scale
precipitation.
