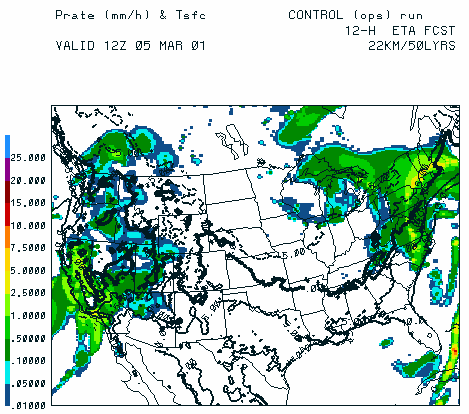
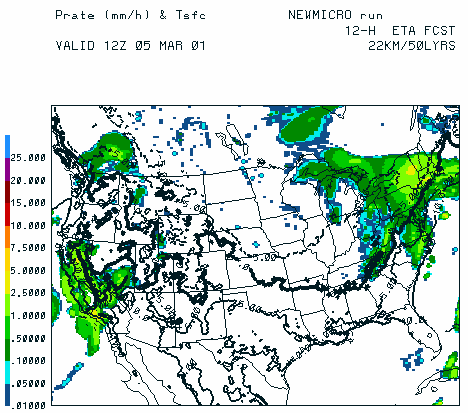
Figure 3.5(a) 12-h forecasts of precipitation rate (mm/h) and surface
temperature valid at 12Z on 5 March 2001 from the operational control (left)
and the new grid-scale microphysics (right). Bold line is the 0C isotherm,
dashed lines are for colder temperatures, and solid lines are for warmer
temperatures.
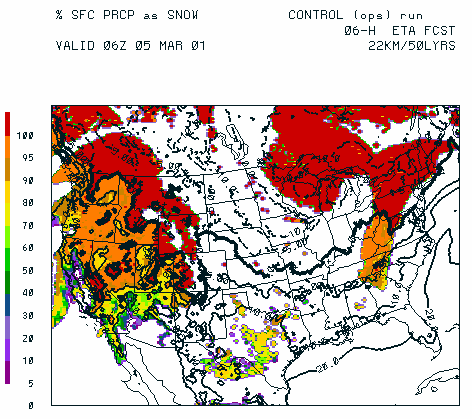
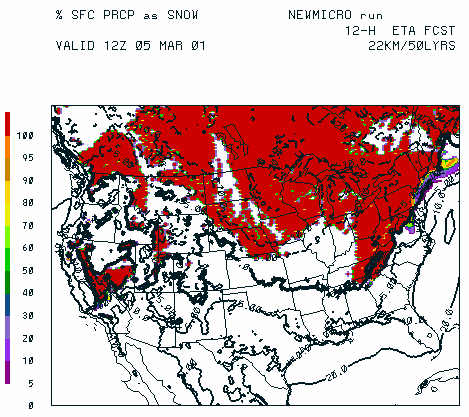
Figure 3.5(b) 12-h forecasts of precipitation type derived from the model,
shown as the fraction of the instantaneous precipitation rate in the form of snow.
Note the large area of mixed snow and rain at warm temperatures in the operational
control (left), which is not present in the new grid-scale microphysics (right).
Trace amounts of snow in the operational control run reached the ground over areas
with surface temperatures exceeding 10C. The new microphysics typically shows
much sharper contrast and distinction between areas of rain and snow, except along
the mid-Atlantic and southern New England coast near the 0C isotherm.