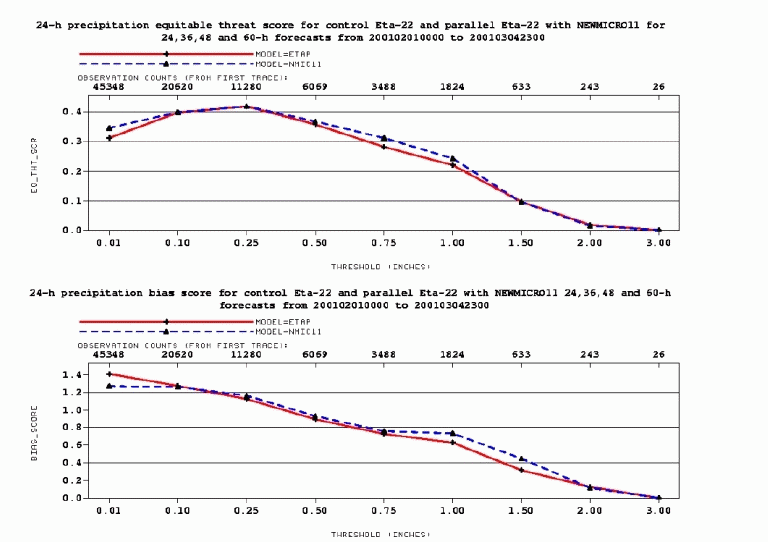
Figure 3.2 (top): Equitable threat scores from 24-h, 36-h, 48-h, and 60-h
forecasts made using the new grid-scale scheme (blue dashed line) and the operational
control (red solid line) for the period from 00 Z on 1 February 2001 through 23Z on 04
March 2001.
Figure 3.2 (bottom): Same as above, except that bias scores are shown (blue
dashed lines for forecasts made using the new grid-scale microphysics, red solid lines
for forecasts made using the operational control forecasts).
