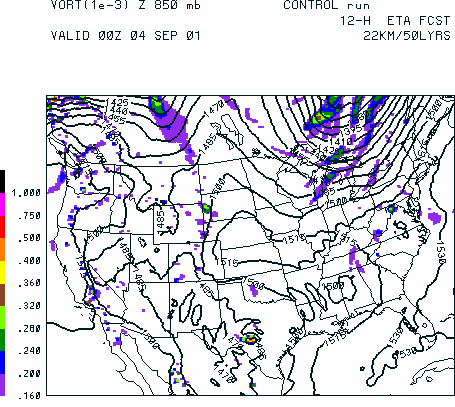
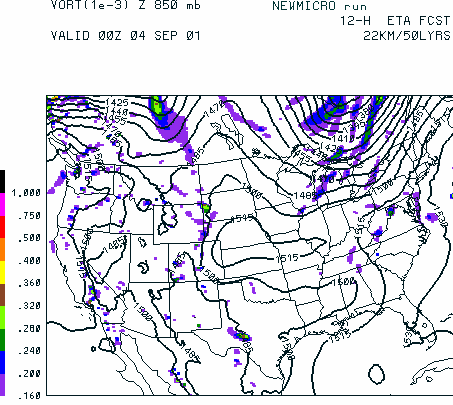
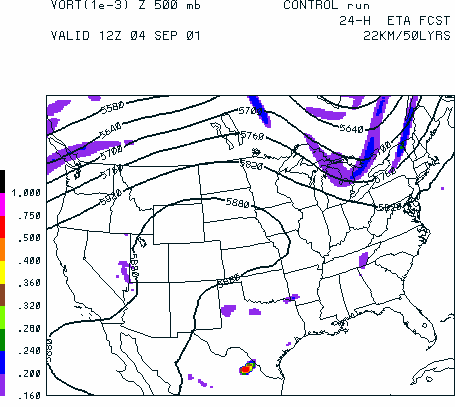
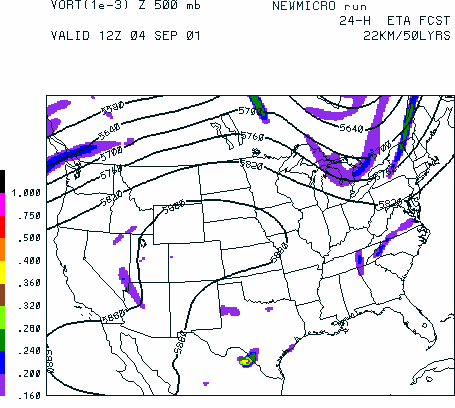
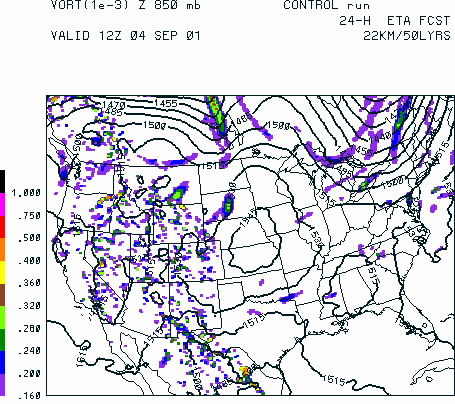
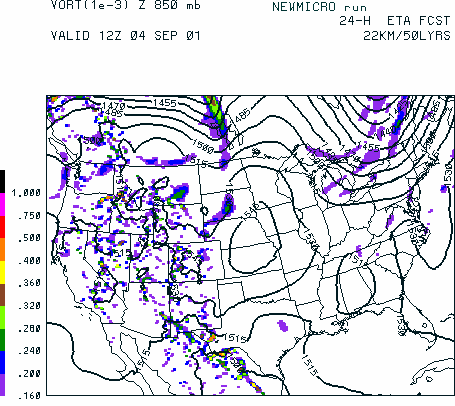
Figure 3.13(a) Same as Fig. 3.12, except for the 22-km runs. In (a) the
12-h forecast of absolute vorticity (color area fill in units of 10**-3 s-1) and
geopotential height (Z, contour lines in units of dam) at 850 mb are valid at 00Z
on 4 September 2001 for the operational control (left) and the new grid-scale
microphysics (right). The noise in the geopotential heights can also be seen in the
22-km operational control run, particularly at lower levels in the vicinity of the
intense precipitation.
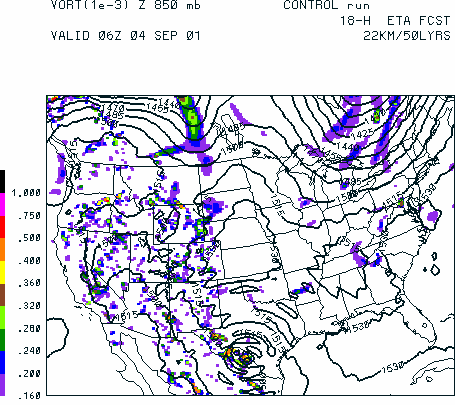
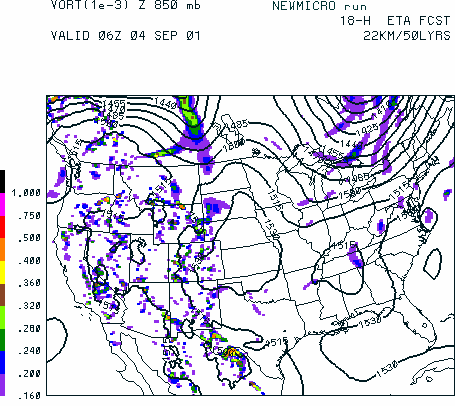
Figure 3.13(b) Same as (a) except for the 18-h forecast.
Figure 3.13(c) Same as (a) except at 500 mb for the 24-h forecast. The
geopotential heights in the operational control are relatively smooth at this
level by this time, however, the more intense diabatic heating in the operational
control is producing a stronger vorticity signature.
Figure 3.13(d) Same as (c) except at 850 mb. The noise in the geopotential
height field is more noticeable at this level in the operational forecast.
