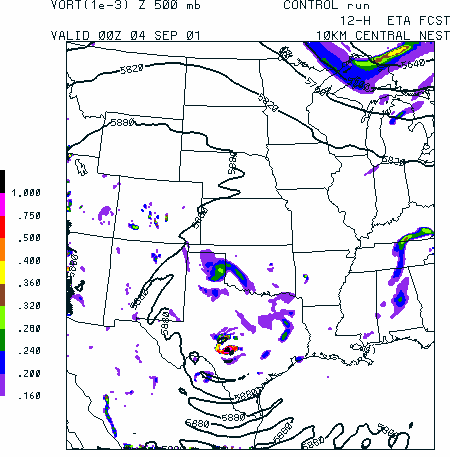
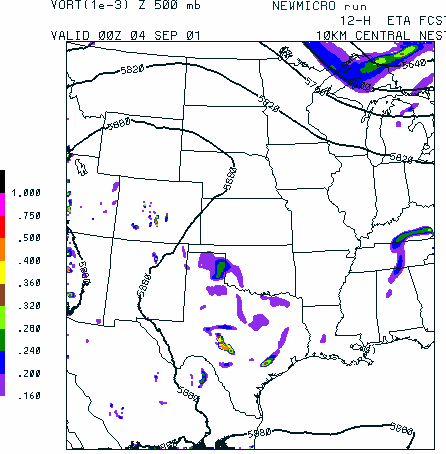
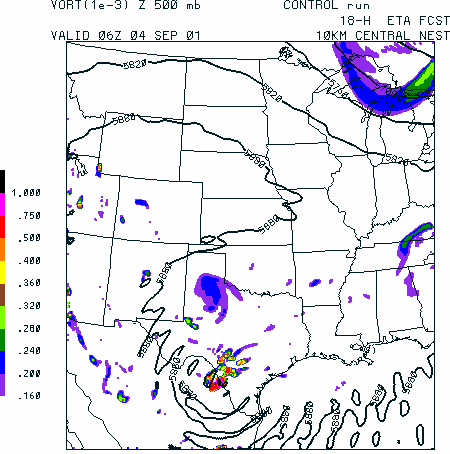
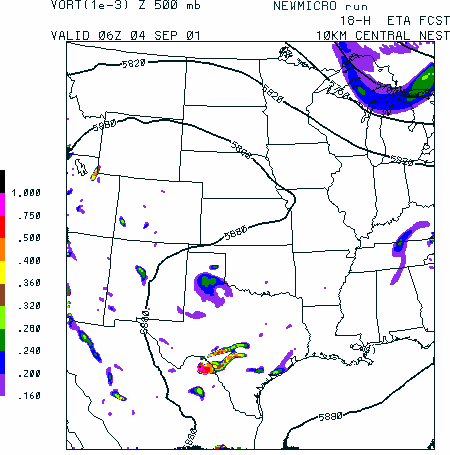
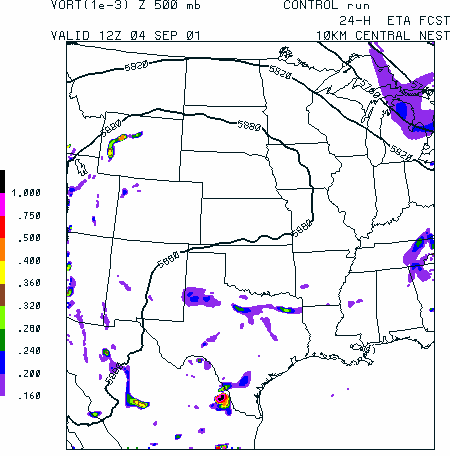
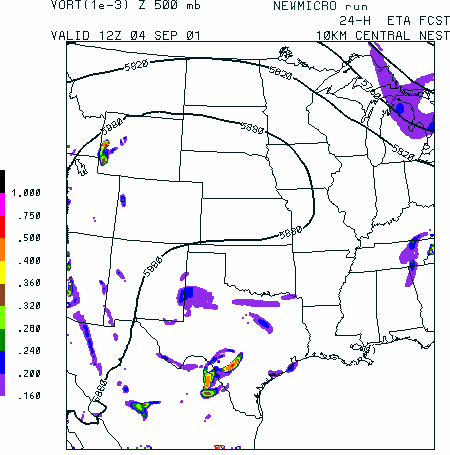
Figure 3.12(a) 12-h forecast of absolute vorticity (color area fill in units of
10**-3 s-1) and geopotential height (Z, contour lines in units of dam) from the 10-km
Eta central nest valid at 00Z on 4 September 2001 for the operational control (left)
and the new grid-scale microphysics (right). The episodic temperature updates by cloud
processes in the operational control results in a noisy geopotential height field, which
is absent in the new grid-scale microphysics when the temperature is continuously updated
every time step. The vorticity of the convective system over southwestern Texas is also
noticeably stronger in the operational control than in the new microphysics scheme.
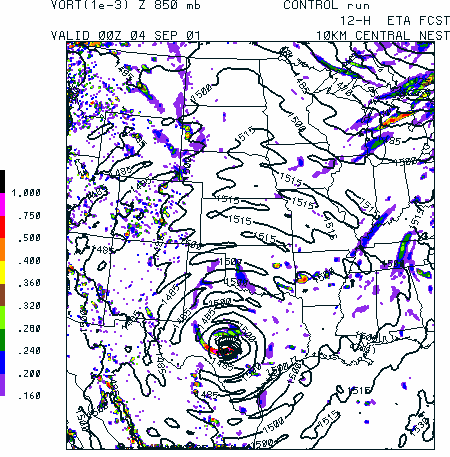
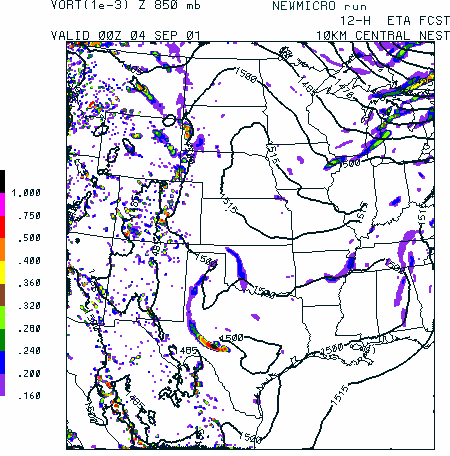
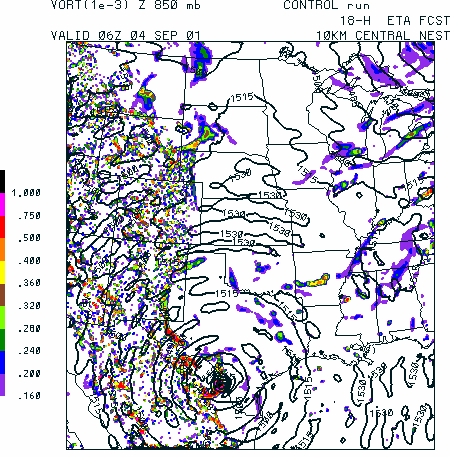
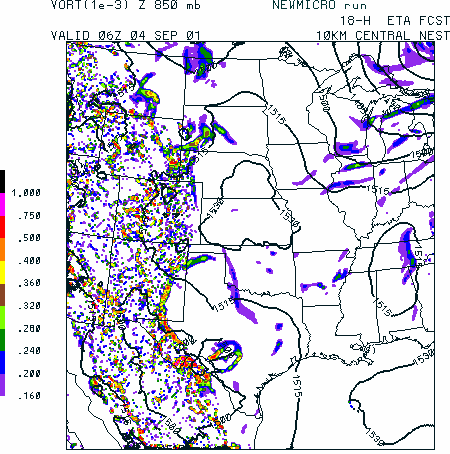
Figure 3.12(b) Same as (a) except at 850 mb. Many of the features in (a) are
reproduced here, except that the geopotential height field is noisier in the control run at
this lower level in response to more intense latent heating by grid-scale precipitation.
Figure 3.12(c) Same as (a) except for the 18-h forecast.
Figure 3.12(d) Same as (b) except for the 18-h forecast.
Figure 3.12(e) Same as (a) except for the 24-h forecast. The maximum vorticity
associated with the convective system in northern Mexico is stronger in the operational
control run as a result of more intense, sustained diabatic forcing by the grid-scale
precipitation scheme.
