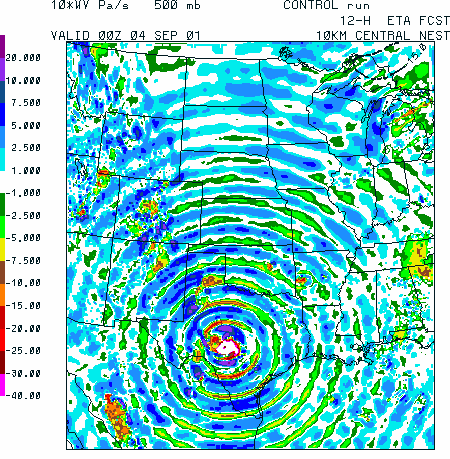
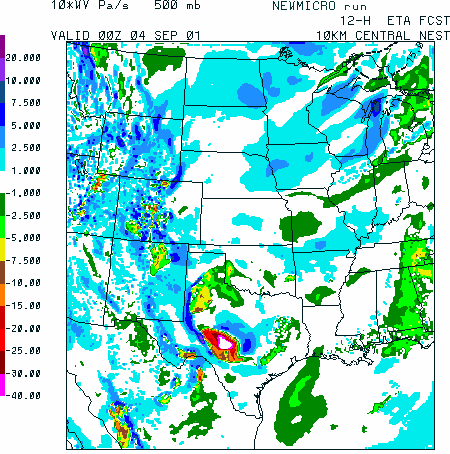
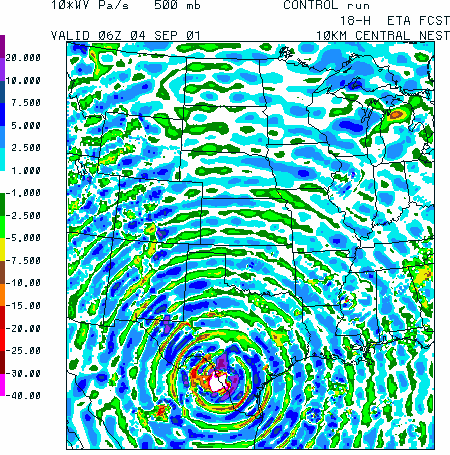
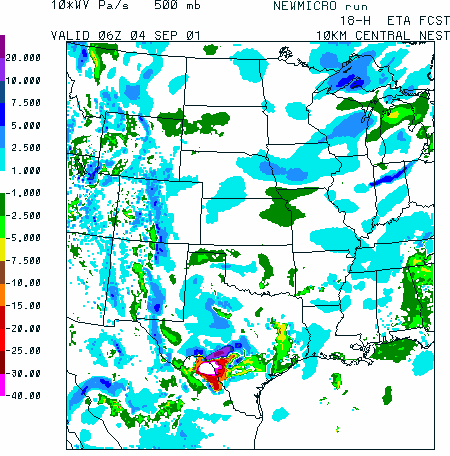
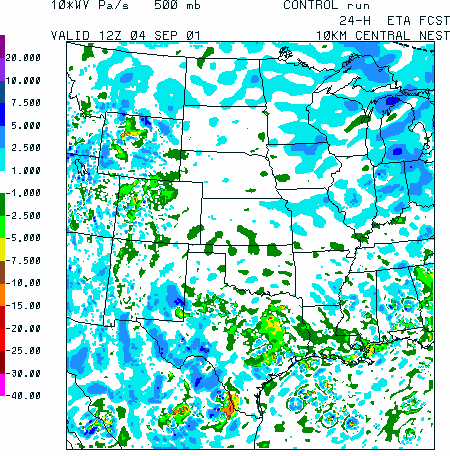
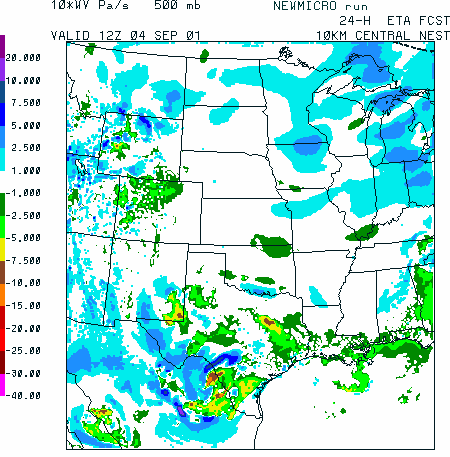
Figure 3.10(a) 12-h forecasts of the 500-mb vertical motion fields from the
10-km central nest valid at 00Z on 4 September 2001 for the operational control
(left) and the new grid-scale microphysics (right). As in Fig. 3.7, the vertical
motion is expressed in 10*Pa/s with negative values denoting upward motion. Strong
gravity waves forced by heavy grid-scale precipitation over southwestern Texas in
the operational control run (see Fig. 3.8) are large enough in amplititude as to
obscure other vertical motion features.
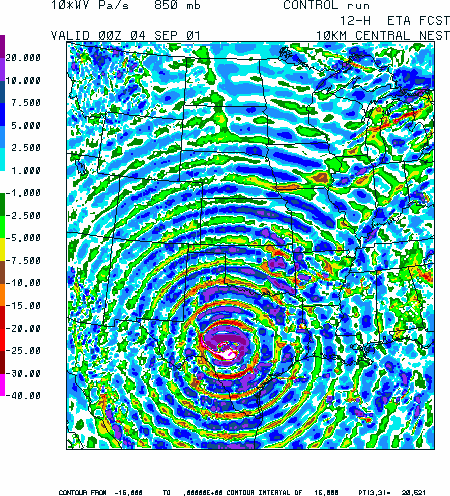
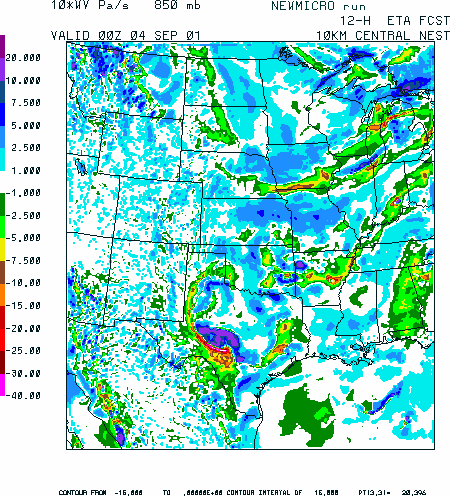
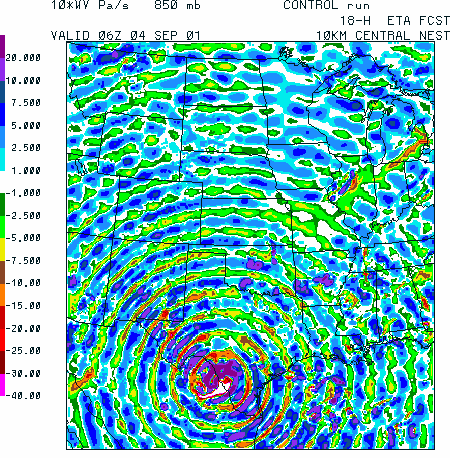
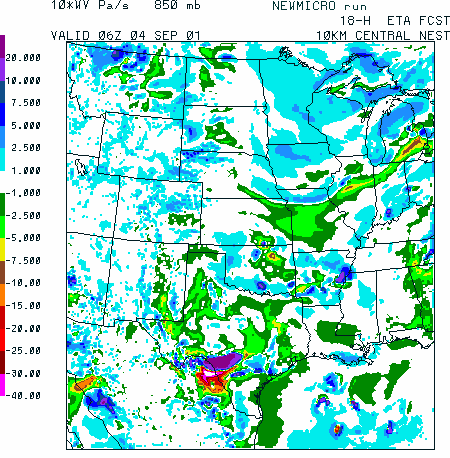
Figure 3.10(b) Same as (a) except at 850 mb.
Figure 3.10(c) Same as (a) except for the 18-h forecast.
Figure 3.10(d) Same as (b) except for the 18-h forecast.
Figure 3.10(e) Same as (a) except for the 24-h forecast. Spurious gravity-wave
forcing is much less evident in the 500-mb vertical motion fields after this time, and
they are not seen at 850 mb due to weaker diabatic forcing.
