Monthly composite of model 84-hour diurnal forecasts
(mesoscale) NAM model only, and NAM, GFS, and NGM models verified against observations averaged by region and composited on a monthly basis.
Annual time series of 48-hour forecast bias
Annual time series of the bias of the 48-hr forecast from the NAM model verified against observations averaged by region for the given year.
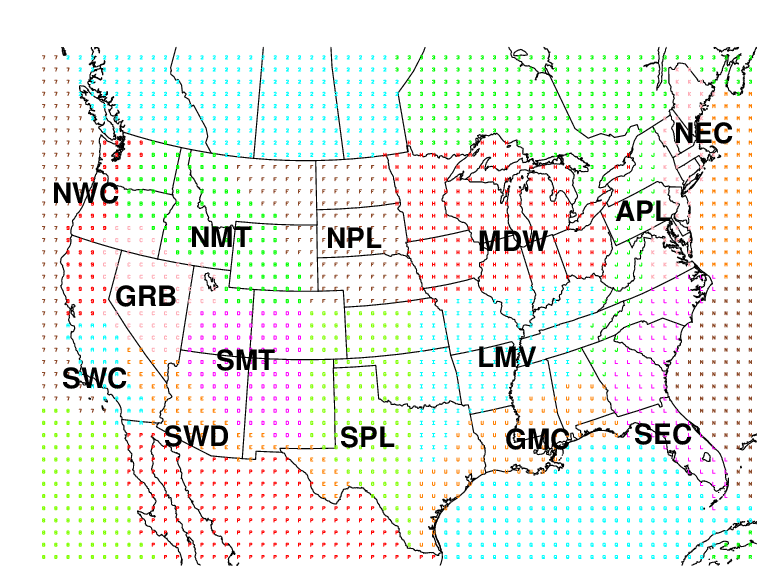
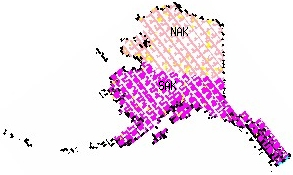
Forecast Verification Statistics (FVS) regions:


east = FVS regions: MDW,APL,NEC,LMV,GMC,SEC
west = FVS regions: NWC,GRB,NMT,NPL,SWC,SWD,SMT,SPL
An explanation of how the plots are made and how to read the plots, and additional comments can be found here.
page updated 09 December 2010


