INCREASE IN HORIZONTAL RESOLUTION
AND MEMBERSHIP
OF THE NCEP GLOBAL ENSEMBLE
FORECASTING SYSTEM
Zoltan Toth1, and Istvan
Szunyogh2
National Centers for Environmental
Prediction
1 GSC (Beltsville, MD) at NCEP
2 UCAR Visiting Scientist
W/NP20, World Weather Building,
Washington DC 20233, USA
CONTENT
SUMMARY
MOTIVATION
CURRENT
CONFIGURATION
BACKGROUND
PROPOSED CONFIGURATION
EXPERIMNETAL RESULTS
POSTPROCESSING CHANGES
OUTLOOK CREDITS
REFERENCES
SUMMARY
The configuration of the NCEP global ensemble
forecasting system has not been upgraded since March 1994. The new
IBM SP supercomputer now makes it possible to improve the ensemble system.
It is proposed that (1) the horizontal resolution for all perturbed ensemble
members is increased from T62 to T126; (2) the number of ensemble members
at the 1200 UTC cycle is increased from 4 to 10; and (3) the postprocessing
of the ensemble forecasts is changed to reflect these upgrades. Results
from both operational forecast statistics and preimplementation tests indicate
that the changes, as expected, have a positive impact, making the ensemble
forecasts more useful overall.
MOTIVATION
The current configuration of the NCEP global ensemble forecasting system
was implemented more than 6 years ago, in March 1994, after the aquisition
of the Cray90 supercomputer. Though there have been minor
changes implemented, the basic configuration of the system has not
been changed since. The aquisition of a new IBM supercomputer in 1999 makes
it possible to consider an upgrade to the existing ensmeble forecast system.
CURRENT
CONFIGURATION
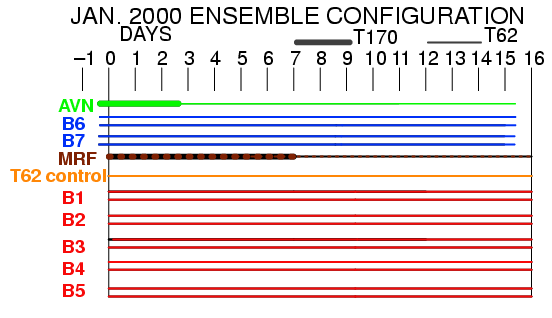
The current operational ensemble configuration consists of running:
-
At 0000 UTC each day:
-
T170 high resolution control out to 7 days, after which this run gets truncated
and is run out to 16 days at a T62 resolution
-
T62 control that is started with a truncated T170 analysis
-
10 perturbed forecasts each run at T62 horizontal resolution. The perturbations
are from five independent breeding cycles (see Toth and Kalnay, 1993, 1997).
Each perturbation is both added to, and subtracted from the control analysis.
-
At 1200 UTC:
-
T170 control out to 3 days ("Aviation forecast"), that gets truncated and
run at T62 resolution out to 16 days
-
Two pairs of perturbed forecasts based on two independent breeding cycles
(four perturbed integrations out to 16 days.)
BACKGROUND
The value of the current ensemble forecast system is limited in the
following ways.
1) The perturbed forecasts are run at the low T62
horizontal resolution, therefore the forecasts have a suboptimal performance
both in terms of their systematic and random errors. This is a well known
problem noted by the users.
2) The system's ability is further limited by the
relatively small number of perturbed forecasts in:
a) Identifying extreme/rare events
b) Serving customers with high or low cost-loss ratios
c) Providing flow dependent covariance information
used in targeted observations and possibly in the analysis
d) Provinding twice daily perturbed boundary conditions
for the NCEP limited area ensemble. Without more global ensemble forecasts
introduced at the 12 UTC cycle, the planned regional ensemble system cannot
be run.
Research conducted during the past few years, primarily at ECMWF, demonstrated
that problem (1) can be well addressed by the use of a higher resolution
model version. The introduction of a T159 resolution model in their ensemble,
in place of the T63 model, imporved the overall performance of their ensemble
significantly (Buizza et al., 1998). These studies also showed that the
increase of ensemble membership (in their case, from 33 to 50 members)
has substantial benefits with respect to problems listed under points 2a
and 2b above. Regarding problem 2c above, a study by Houtekamer and Mitchell
(1998), and Toth and Szunyogh (1997) demonstrated that analysis and targeted
observational work, respectively, can greatly benefit from increased ensemble
membership.
PROPOSED
CONFIGURATION
To solve or ameliorate the problems listed above, we propose the implementation
of the follwoing changes to the existing system:
1) Increase the horizontal resolution of all perturbed
ensemble members from T62 to T126 for the first 84 hrs of integration
2) Increase the number of perturbed forecasts at
the 1200 UTC cyle from 4 to 10
3) Implement corresponding changes in the postprocessing
of the ensemble data
With the above changes, the proposed configuration of the global ensemble
system is:
0000 UTC:
a) T170 (MRF) control forecast out to 7 days, truncated
to T62 afterwards, integrated out to 16 days
b) T126 ensemble control out to 84 hrs, T62 afterwards,
out to 16 days
c) 10 perturbed forecasts with T126 resolution out
to 84 hrs, T62 afterwards, out to 16 days
1200 UTC:
a) T170 (MRF) control forecast out to 3 (or 5) days,
truncated to T62 afterwards, integrated out to 16 days
b) T126 ensemble control out to 84 hrs, T62 afterwards,
out to 16 days
c) 10 perturbed forecasts with T126 resolution out
to 84 hrs, T62 afterwards, out to 16 days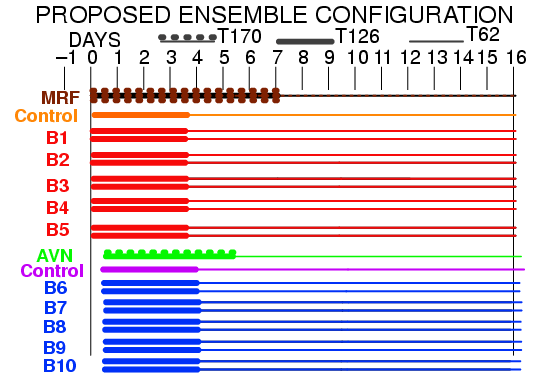
With the new configuration, the ensemble forecasts will be symmetrically
arranged at 00 UTC and 12 UTC, which will have positive consequences with
respect to their general use. Note that the forecasts will have a uniform
resolution for the short range forecast period, providing high quality
forecast guidance, and boundary conditions for the limited area ensembles.
The proposed configuration amounts to an increase in cpu resources of
a factor of 3.7, well below the actual cpu increase of 4.5-5, due to the
implementation of the new IBM supercomputer. Note that the resolution of
the MRF control forecast was recently changed from T126L28 to T170L42,
which amounts to a cpu increase of the same order (factor of 3.7).
EXPERIMENTAL
RESULTS
It is widely known that the T126 version of the MRF model has a superior
performance to that of the T62 version of the same model. We present two
aspects of this superiority in terms of operational forecast verification
statistics. First, the T126 control model forecasts exhibit less rms error
(see figure), and higher pattern anomaly correlation scores (not shown):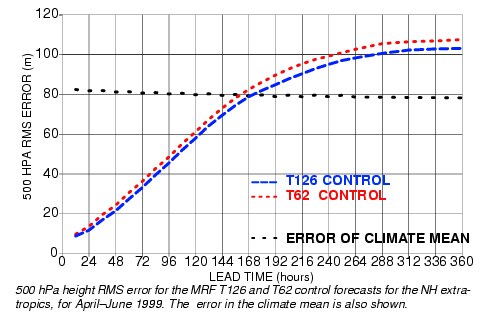
Second, when the two control forecasts are evaluated in the framework
of the full ensemble, the T126 forecasts are found to be the closest member
to the verifying analysis field more often than the T62 control (or the
T62 pertubed forecasts):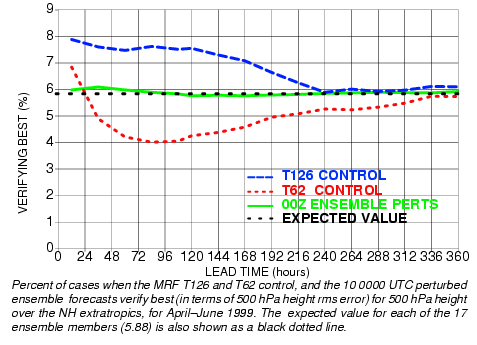
Note the large difference in the average frequency values of a forecast
being the best in favor of the T126 resolution model: around 4 days
lead time, the high resolution model is almost twice as likely to be the
best than the low resolution version. These results clearly indicate that
the higher resolution of the T126 model version helps the individual forecasts
perform better.
To evaluate the impact of the proposed increase in resolution for the
ensemble, two 10-member, otherwise identical sets of ensembles were generated
for a 30-day period between January 13 - February 12, 1999. The first set
was a replica of the currently operational system at 0000 UTC, while the
other used T126 resolution for the first 3 days, and T62 thereafter. A
comparison of the performance of the ensemble mean forecasts from the two
10-member ensembles for the Northern Hemisphere (NH) extratropics revealed
that the ensemble that had the higher T126 resolution for the first
3 days had considerably higher Pattern Anomaly Correlation (PAC) scores
out to seven days and beyond (see figure).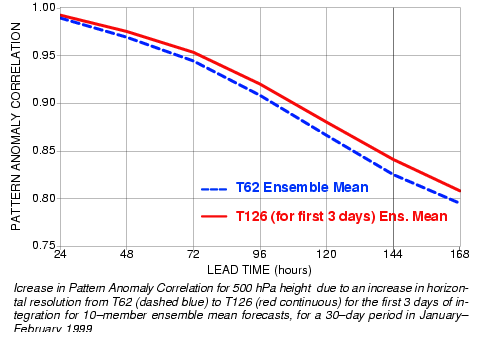 Predictability is extended by the proposed system as demonstrated by
its PAC values dropping to that of the level of the operational system
8 (16) hours later around the 3 (6) days lead time.
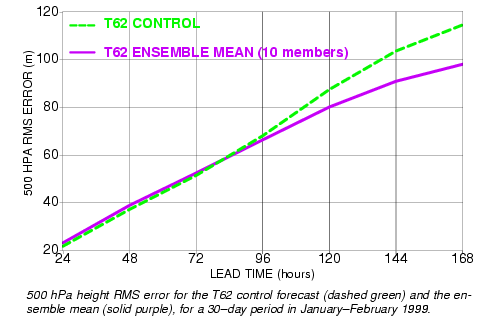
The RMS errors for the two systems confirm the above results. On the
next figure shown is the rms error for the MRF control forecast (T126 out
to 7 days), and for the proposed ensemble configuration (first 3 days T126,
then T62), for the NH extratropics. The error for the ensemble mean, as it should be for a well performing
system, is at or below the level of the control forecast error. Note that
this is not the case for the operational T62 resolution ensemble, whose
mean forecast performs poorer than its control during the first 3 days
of the integration (see figure).
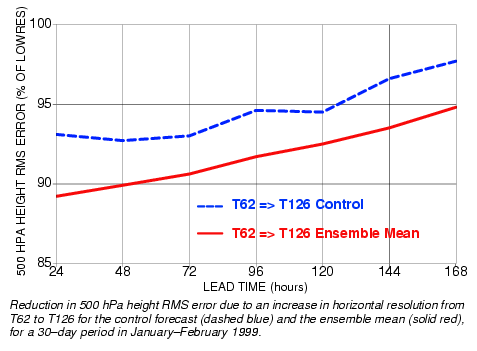
 An analysis of the results indicates that the the difference in the performance
of the two ensemble means is most pronounced near orographic areas. This
is not surprising since the only difference between the two ensembles compared
is their horizontal resolution. The impact of increased resolution
is in fact larger for the ensemble mean forecast than it is for the control
forecast (see figure). Increasing the resolution for the first three
days of integration results in an rms error reduction of 11-5% for the
ensemble, and only 7-2% for the control, evaluated over the first week
of forecasts.
  We speculate that the lower resolution model may exhibit some unrealistic
instabilities related to erroneously resolved orography and that these
instabilities may contaminate the ensemble forecasts more than the control
forecasts. Therefore the resolution seems to benefit more the ensemble
system than the control forecasts.
The performance of the proposed system was also evaluated over the Southern
Hemispheric extratropics and over the tropics. In these areas the increased
horizontal resolution still has a positive, though less pronounced impact.
POSTPROCESSING
CHANGES
Currently 2.5x2.5 latitude/longitude grid
output files are generated for the global ensemble forecasts, for selected
variables.
1) The increased resolution
of the ensemble forecasts necessitates the introduction of 1x1 lat/lon
files for the first 84 hrs, for maximizing the value of these forecasts
to the users. These files will be generated in addition to the 2.5x2.5
resolution files.
2) At the same time, we plan
to introduce a new set of files called "ensstat" that will contain different
statistics based on the ensemble that can be later augmented by additional
information. At this time, we plan to introduce ensemble mean and standard
deviation, and normalized
ensemble spread, for each lead time separately. For spread normalization,
we will compute the average ensemble spread over the most recent past 30-day
period. For the same period, the average error in the ensemble mean forecast
will also be computed. To the degree the average error is larger than the
average spread, the ensemble's spread is insufficient. We will evaluate
whether a simple bias correction in the spread of the ensemble can be applied
to the ensemble forecast data to ameliorate this problem, and to provide
a zero order calibration for probabilistic forecasts.
3) The average of the ensemble
mean forecasts for each lead time for the most recent 30 days, and the
corresponding average for the verifying analyses will also be computed.
This will allow for the implementation of a simple bias correction to reduce
the systematic error in the first moment of the forecasts, based on the
mean error over a 30-day preceding period.
OUTLOOK
The current changes represent the first step in
the upgrade of the global ensemble forecast system. Once the second phase
of the IBM SP machine is operational, we expect to propose a second upgrade,
where the T126 resolution would be extended to 7.5 days, and additional
ensemble members would be introduced at the 0600 and 1800 cycles (10 at
both cycles). The two upgrades arranged this way are to maximize the utility
of the ensemble forecasts, given the increased computational resources,
while keeping changes to the system at a minimum.
CREDITS
Yannick Tremolet provided invaluable help in the
process of setting up the ensemble forecast system in a parallel computational
environment. Mark Iredell, Hua-Lu Pan, and Steve Lord gave advice and encouragement
during the course of the research.
REFERENCES
Buizza, R., Petroliagis, T., Palmer, T. N., Barkmeijer, J., Hamrud,
M., Hollingsworth, A., Simmons, A., and Wedi, N., 1998: Impact of model
resolution and ensemble size on the performance of an ensemble prediction
system. Q. J. R. Meteorol. Soc., 124, 1935-1960.
Houtekamer, P. L., and H. L. Mitchell, 1998: Data assimilation using
an ensemble Kalman filter technique. Mon. Wea. Rev., 126, 796-811.
Toth, Z., and E. Kalnay, 1993: Ensemble Forecasting at the N MC: The
generation of perturbations. Bull. Amer. Meteorol. Soc.,
74, 2317-2330.
Toth, Z., and E. Kalnay, 1997: Ensemble forecasting at NCEP and the
breeding method. Mon. Wea. Rev, 125, 3297-3319.
Toth, Z., and I. Szunyogh, 1997: Review of the use of ECMWF ensemble
data for targeting upstream observations during the FASTEX field experiments.
In: Proceedings of the FASTEX Upstream Observations Workshop, NCEP, Camp
Springs, Md, April 10-11, 1997. NOAA/NWS/NCEP Office Note 420, p. 131.
[Available from: Environmental Modeling Center, 5200 Auth Rd., WWB, Rm.
207, Camp Springs, MD 20746.]


 Predictability is extended by the proposed system as demonstrated by
its PAC values dropping to that of the level of the operational system
8 (16) hours later around the 3 (6) days lead time.
 The error for the ensemble mean, as it should be for a well performing
system, is at or below the level of the control forecast error. Note that
this is not the case for the operational T62 resolution ensemble, whose
mean forecast performs poorer than its control during the first 3 days
of the integration (see figure).
 An analysis of the results indicates that the the difference in the performance
of the two ensemble means is most pronounced near orographic areas. This
is not surprising since the only difference between the two ensembles compared
is their horizontal resolution. The impact of increased resolution
is in fact larger for the ensemble mean forecast than it is for the control
forecast (see figure). Increasing the resolution for the first three
days of integration results in an rms error reduction of 11-5% for the
ensemble, and only 7-2% for the control, evaluated over the first week
of forecasts.
  We speculate that the lower resolution model may exhibit some unrealistic
instabilities related to erroneously resolved orography and that these
instabilities may contaminate the ensemble forecasts more than the control
forecasts. Therefore the resolution seems to benefit more the ensemble
system than the control forecasts.