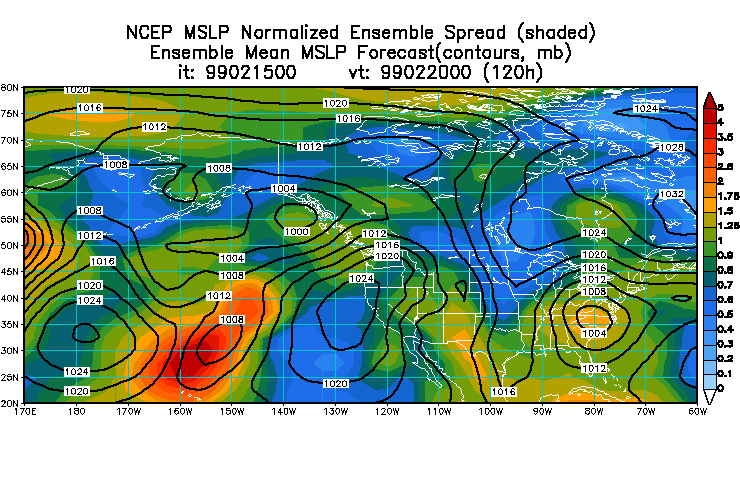
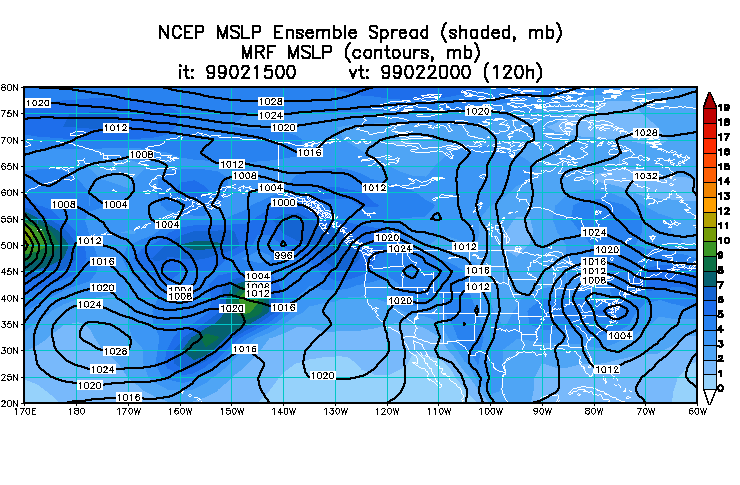
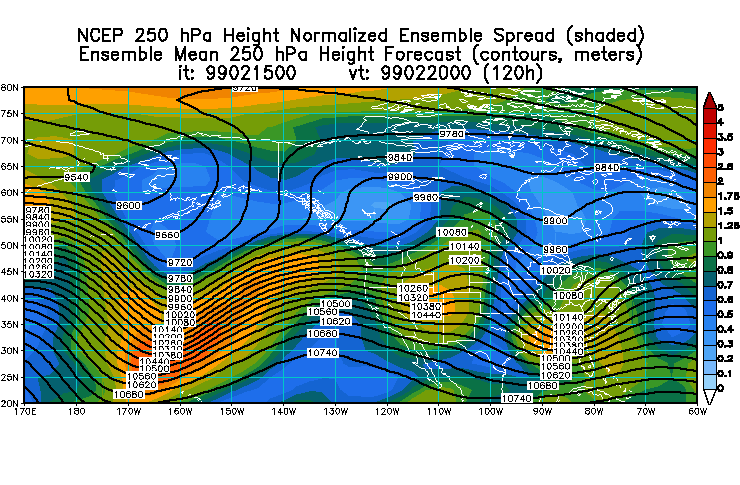
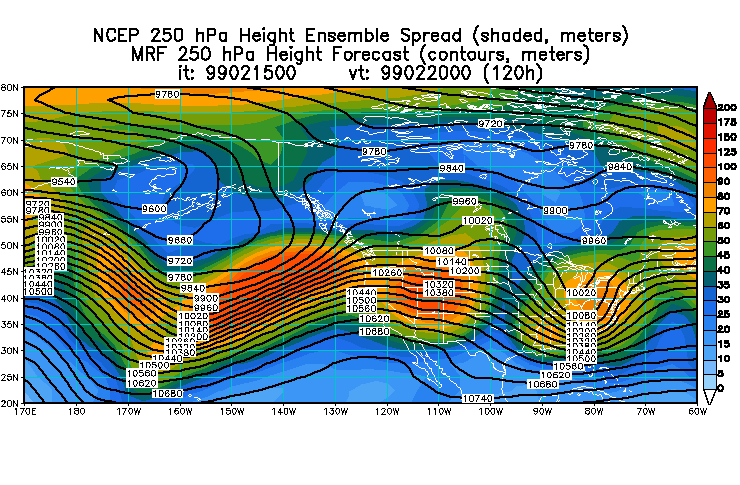
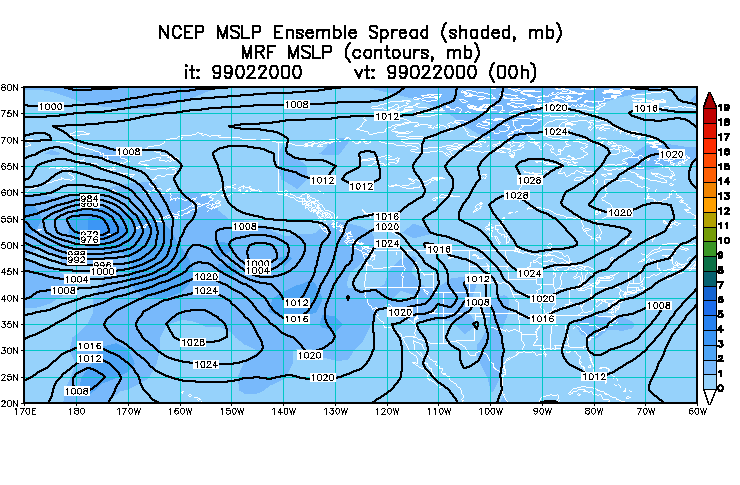
I looked at the 5-day lead time MSLP
EM (NCEP ensemble mean) / MRF
(high resolution control), and 250
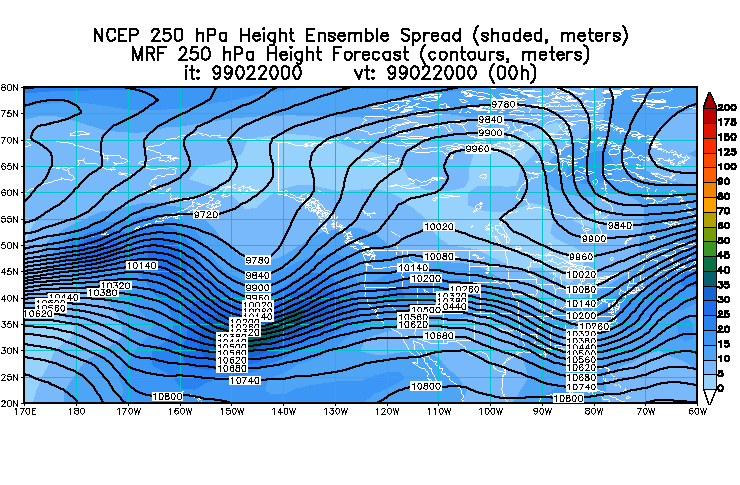
hPa EM / MRF
forecasts verifying at 99022000, and compared it with the verifying
MSLP / 250
hPa analysis. On these charts I note the following:
1) At both levels, the low pressure system in question
is associated with ensemble spread (indicator for uncertainty in ensemble
mean forecast) that is higher than that found at these lead times during
the previous 30-day period (1.5 times or more than average spread). On
the ensemble mean charts the spread is normalized by average spread observed
in the fcsts over the last 30 days. It's easy to be wise afterwards, but
this is clearly not a sign that someone should have had high confidence
in the forecast.
2) Actual spread at surface associated with the system
is up to 6 mb; at 250 hPa, it's up to 80-100 m. (On MRF fcst charts the
actual spread is shown.)
3) Error in ensemble mean fcst near center of fcst
low is around 6 mb at surface and around 100 m at 250 hPa. This corresponds
well with actual spread levels noted above (6 mb and 100 m respectively).
This suggests that the ensemble, in a zero degree sense, could have (and perhaps did to some) provided useful guidance regarding expected error levels and possible confidence statements associated with the forecast.
Importantly, the ensemble-based PQPF forecast for an inch or more was less than 30% (which is not very high at 5-day lead time). The MRF was one of the few ensemble members giving more than an inch precip around DC. Should it have been one of the 70% of ensemble members that did not give that much precip, we would not be talking about this case, I guess. That highlights the need for looking at the whole ensemble, not only one or two members of it - otherwise we may be missing much of the story! (I have only hard copies of the precip figures if someone wants a fax.)
Further comments:
a) To answer questions regarding the likelihood of
a low pressure system with characteristics of a possible snow storm around
DC (or somewhere else), one would need more sophisticated postprocessing/display
tools for the ensemble within AWIPS. Such tools could be applied on an
ensemble generated at one center (like the NCEP or ECMWF ensemble); on
an ensemble of control forecasts; or even better, on a grand ensemble,
combining ensembles generated at different centers.
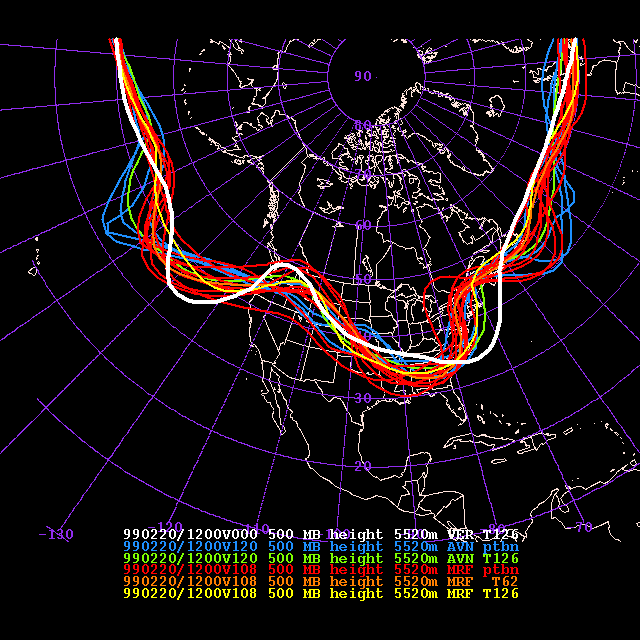
b) There is some indication there may have been a
model bias in the speed the low pressure system was moved along to the
east. As pointed out by others earlier, the MRF fcsts (and also the ECMWF
fcsts) were too slow. Looking at the 4.5-day
500 hPa spaghetti chart I also note that the T62 control (orange/brown)
was even slower than the higher resolution MRF (yellow) or 12-hour earlier
AVN (green) controls. Are these errors due to initial uncertainty or model
bias? The fact that all low resolution ensemble forecasts (red) are around
the T62 control (orange/brown) and they were all far too slow points to
the possibility of a flow dependent model bias (that was probably also
present in the T126 forecasts but was made worse by low resolution). A
higher resolution ensemble (that we should be able to afford on our new
machine) could have helped in this case.
c) The initial error related forecast uncertainty,
if judged unacceptable, can be reduced by taking targeted observations.
Please note that such observations, specifically designed to improve eastern
US weather forecasts, were taken by reconnaissance aircraft flying over
the Pacific during January and February this year. Two notable examples
are flights on the 9th and 10th of February. Due to the extra dropsonde
observations, forecast errors were substantially reduced in the predefined
verification regions. For details, please see:
http://wwwt.emc.ncep.noaa.gov/gmb/targetobs/wsr.html
Overall, this low pressure system was not associated with high degrees
of predictability; moreover, its forecasts may have been hindered by model
bias. There are other cases, however, when predictability is high, and
when, based on the ensemble, confident forecasts can be made even 8-10
days in advance. In these highly predictable cases the expected forecast
errors at 8-10 days lead time can be lower than those for poorly predictable
1-2 days forecasts. For an example, please see:
http://wwwt.emc.ncep.noaa.gov/gmb/ens/target/highpred.html
The 5-day lead "nostorm" (6 mb MSLP spread near center of low, less than 30% PQPF for an inch around DC, low to medium predictability case) and the 9-day lead highly predictable "monster" storm in the Gulf of Alaska (3 mb MSLP spread near center of storm, 70-80% PQPF for an inch precip on west coast) are just two forecast examples indicating that there are some objective tools available right now to evaluate the reliability of forecasts in real time. And with additional efforts, further tools can be developed.