NCEP Medium-Range Ensemble Forecast (MREF) System
Spaghetti Diagrams
Why Do We Need Spaghetti Diagrams?
Mean and spread diagrams give information what is most often (but
not always) the most likely outcome (the ensemble mean) and the degree of uncertainty
in that outcome (the ensemble spread). However, unless the ensemble forecasts
are distributed normally about the ensemble mean, the information in the mean
and spread diagrams can mislead the forecaster if the forecast distribution
clusters around more than one value (so-called multi-modal distributions). Examining
all of the ensemble member forecasts together is a good way to get a
handle on the ensemble forecast distribution.
The forecaster can look at all ensemble members through use of
what are known as "spaghetti" diagrams. These are plan view graphics
of only one or a few contour values for the variable of interest, which keeps
the presentation relatively simple. Spaghetti diagrams are a good complement
to ensemble mean and spread diagrams.
The question arises, how do we know which contour levels would
give the most information? We can actually use the mean and spread diagrams
to give us useful clues. Given that we are interested in the probability of
a forecast variable in regions in high uncertainty, it makes sense to examine
spaghetti diagrams for contours which cross the regions of maximum uncertainty!
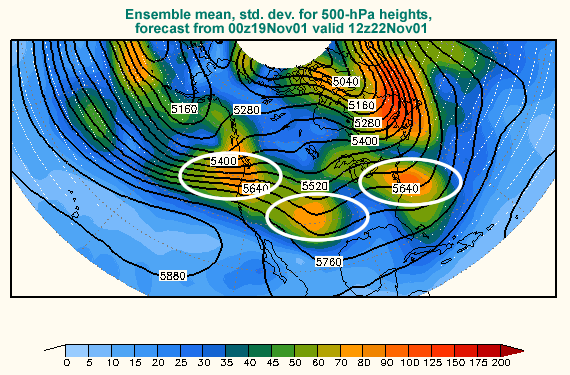
Consider the graphic below:

We see that the 5640-m 500-hPa height contour crosses three areas of relatively
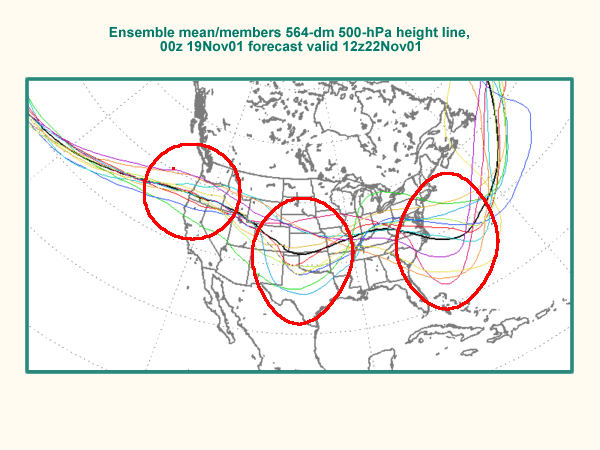
high uncertainty over the continental U.S. We now present the spaghetti diagram
for that height contour below. Each ensemble member is a thin 5640-m contour
of different color, while the ensemble mean 5640-m contour is in black bold.

Note that in the spaghetti graphic:
- The ensemble mean 564-dm contour is smoother than any of the ensemble members,
because features with less agreement among the ensemble members are averaged
out.
- The larger spread in the mean/spread diagram indicated off the U.S. East
coast and over the Great Plains is reflected in the wide dispersion of the
564-dm height line as expected.
- Off the East coast there seem to be clusters of solutions. There are
three members (yellow, orange, magenta) close together in a cluster indicating
a deeper, slower trough. Five more members are clustered slightly higher
than the ensemble mean (red, dark blue, medium blue, light blue, yellow-green)
indicating a more progressive, shallower trough.
- Over the west coast, however, the spread of the contours is relatively small
in spite of the high uncertainty in the mean and spread graphic. This is because:
- This area is marked by a strong meridional (north-to-south) height gradient,
so that
- Small meridional shifts in the heights from member to member result
in large spreads in the height values.
- This can also be interpreted as uncertainty in the meridional location
of maximum winds.
Advantages and limitations of spaghetti diagrams
- Advantages
- Compact presentation of information
- All ensemble members are shown
- We can get an idea of the probability distribution for the forecast
for the contours we display.
- Disadvantages
- Do not have a full picture of the forecast probability distribution
- Requires additional information for good interpretation of products
- Can use spaghetti and ensemble mean and spread diagrams together
(where largest spread indicated) to get a better picture of the ensemble
forecast probability distribution


