


There is no such field as "surface" dew point in the Eta, as the model does not explicitly make predictions for the surface. The most commonly used fields to represent low-level dew point in the model are the 2-meter value and the lowest 30 mb averaged value. The values computed for each of these are often within a few degrees of each other, but consider the following model forecast sounding(for Dodge City, KS) with a very shallow layer of higher dew points (dew point is dashed, temperature is solid).
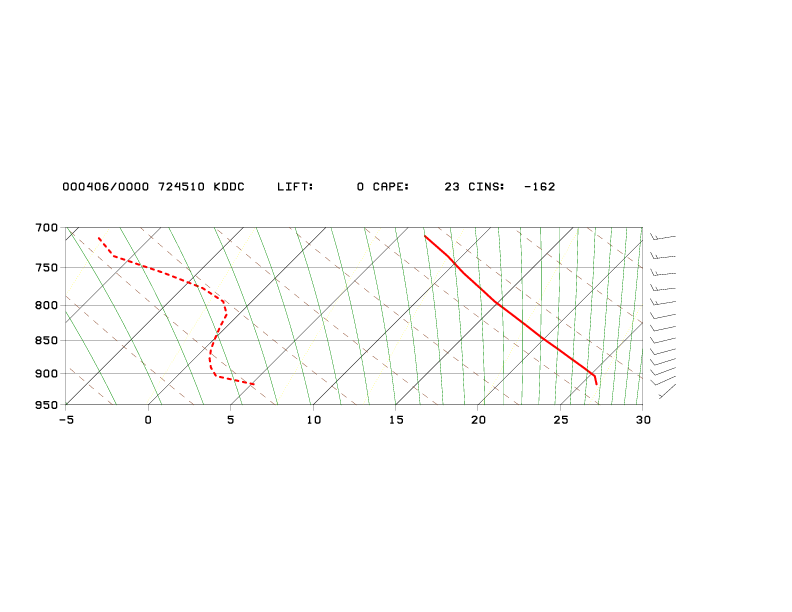
The maps below compare the Eta 2-meter dew points with the 30-mb averaged dew points (degrees F) for this case. Huge differences (as large as 15 degrees F) can be seen over western Kansas.
| 2 METER DEW POINT | 30 MB AVERAGED DEW POINT |
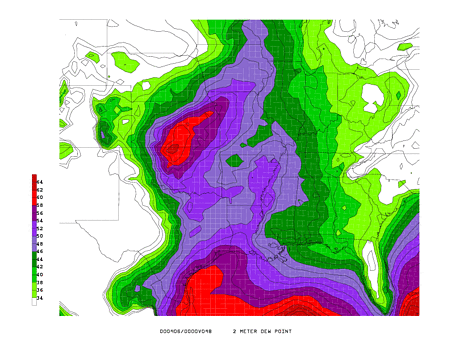 |
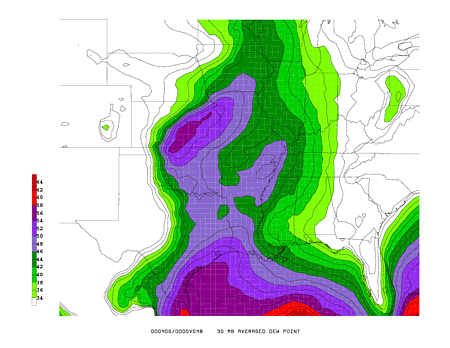 |
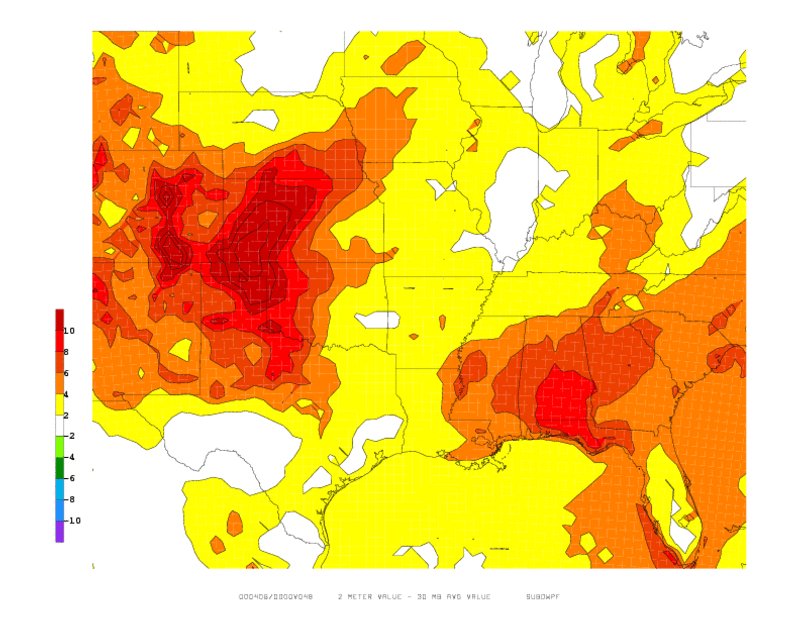
A difference field is shown below (red/orange/yellow colors indicate areas at which the 2-meter value is HIGHER than the 30 mb averaged value):
So, what is the best way to go?
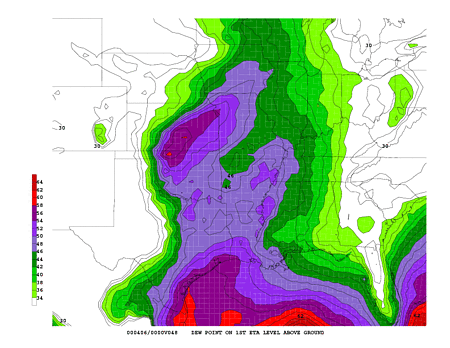
Looking at dew point on the 1st Eta level above ground can be a nice compromise between the other two. One advantage of this choice is that the data is straight from the model with no reduction, averaging, or interpolation. Of course, it may not be ideal for higher terrain locations at which the 1st model level above the ground may be a bit higher than desired. Here is the dew point forecast for the same case on the 1st model level above ground, with the observations on the right.
| 1ST ETA LEVEL ABOVE GROUND DEW POINT | OBSERVED DEW POINT |
 |
 |
Regardless of what level you examine, this example demonstrates that it is always wise to check accompanying model forecast soundings in addition to the regional 2-d plots of dew point to get a picture of the vertical structure of moisture in the boundary layer.
For the archive of past tips of the month, click here