12Z 8 Jun 1993:
NCEP implemented the 80km/38-level Eta analysis and forecasting system (Black, 1994) to provide forecast guidance over North America. A one-year comparison of QPF during 1993-94 showed that the Eta model solidly outperformed the Regional Analysis and Forecast System (the model Eta replaced) during both cold and warm seasons (Rogers, 1995).
12Z 12 Oct 1995:
In the pre-implementation parallel tests, each of these four components proved to have a positive impact on the model's precipitation forecast, both individually and when combined with the three other components (Rogers, 1996. Tests were initially made on either the 48km grid or a 40km grid. In the end the 48km grid was chosen for implementation due to computer limitations at the time).
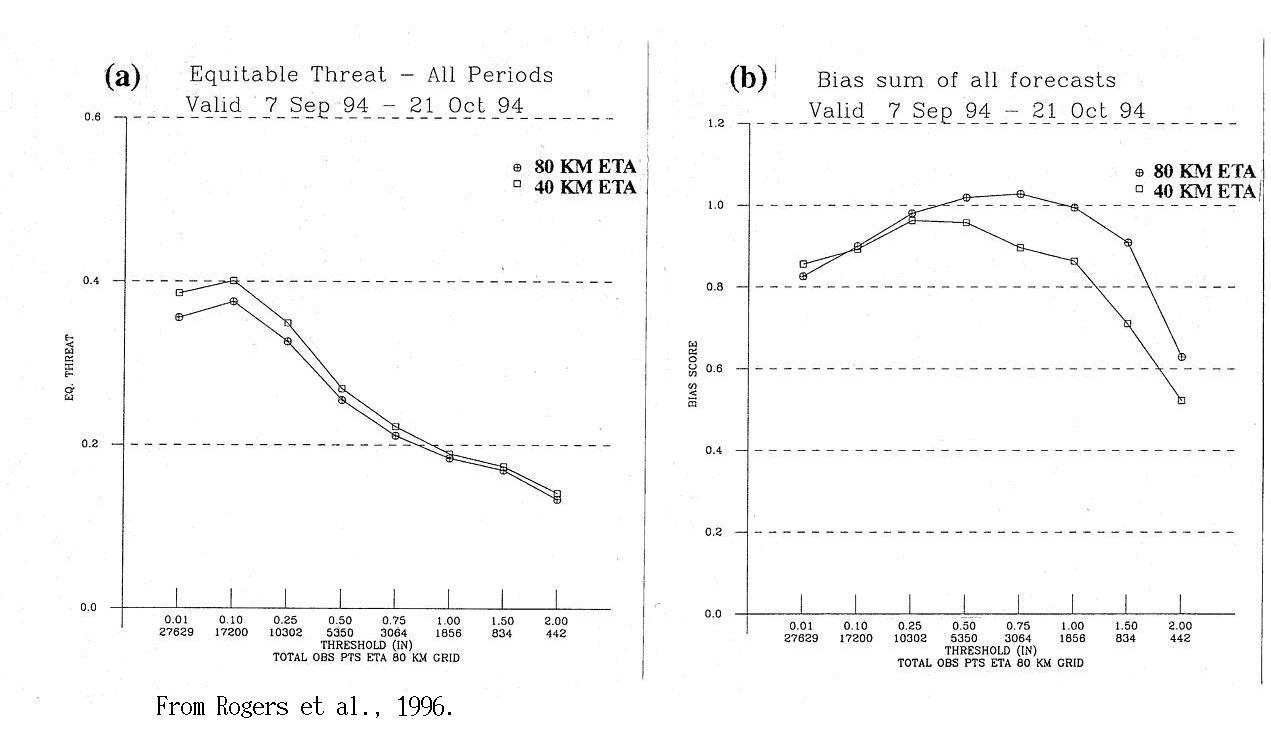
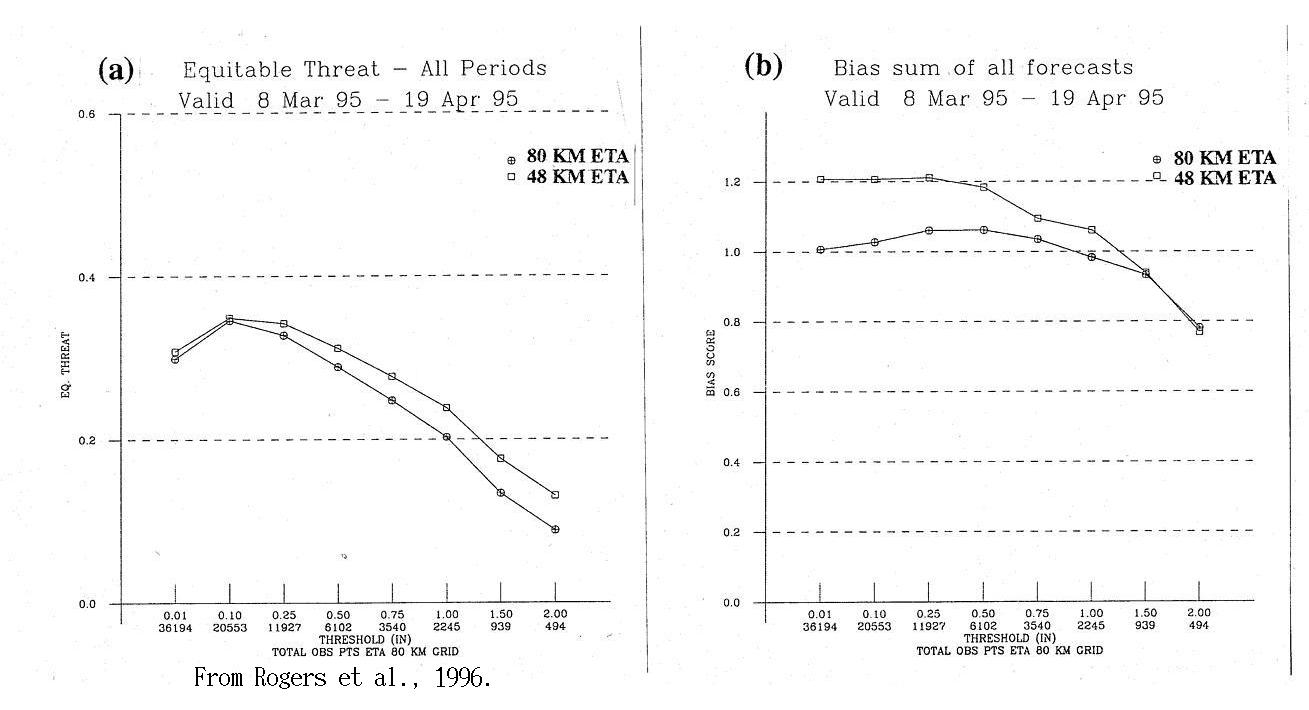
- reduced the horizontal grid spacing from 80km to 48km (QPF scores from test 1 and test 2).
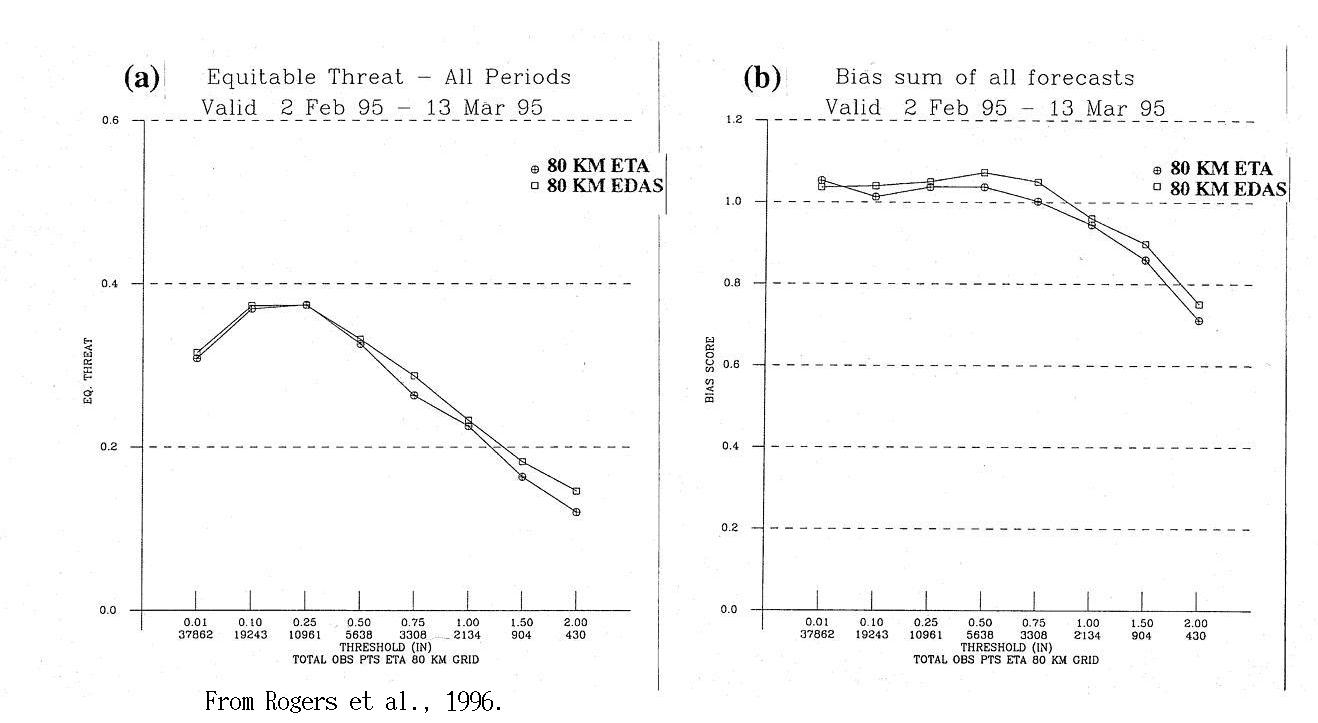
- used a 12h period of Eta-based data assimilation system (EDAS, with 3-hourly optimal interpolation [OI] analysis updates) to provide initial conditions for each cycle of forecast (QPF scores).
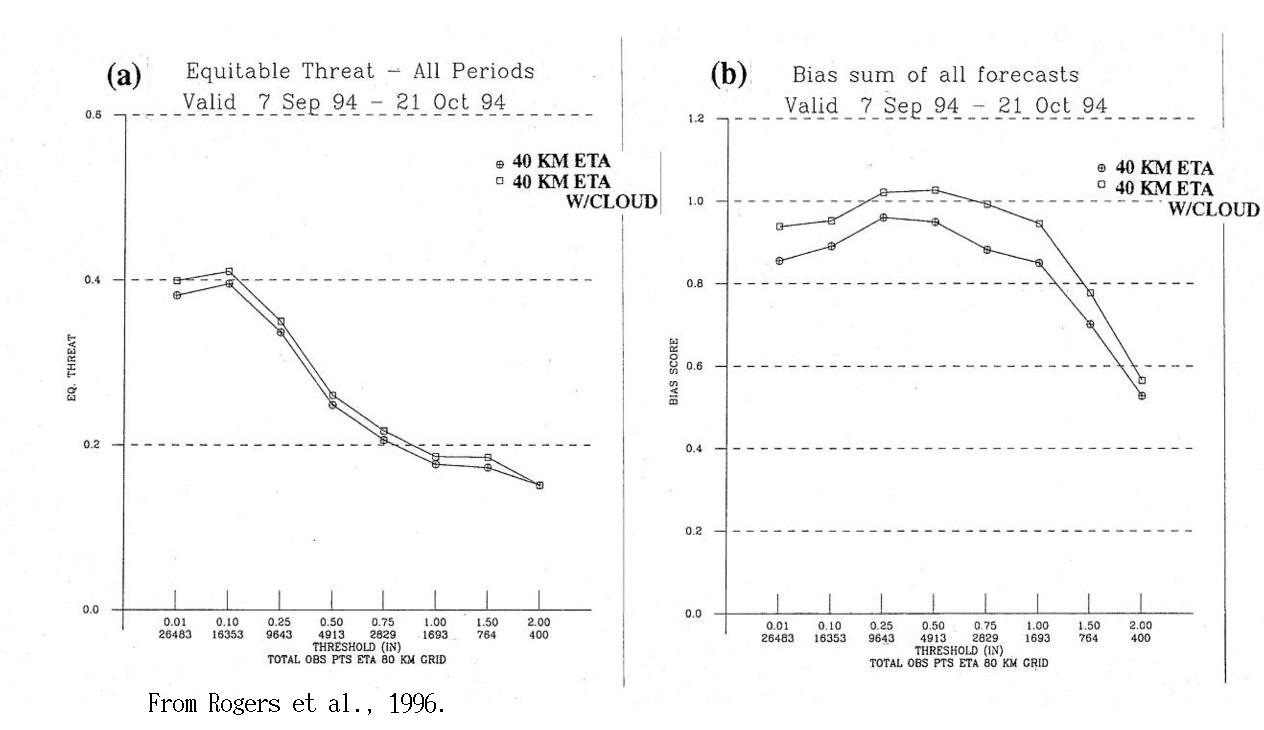
- implemented an explicit cloud prediction scheme (Zhao, 1997. QPF scores).
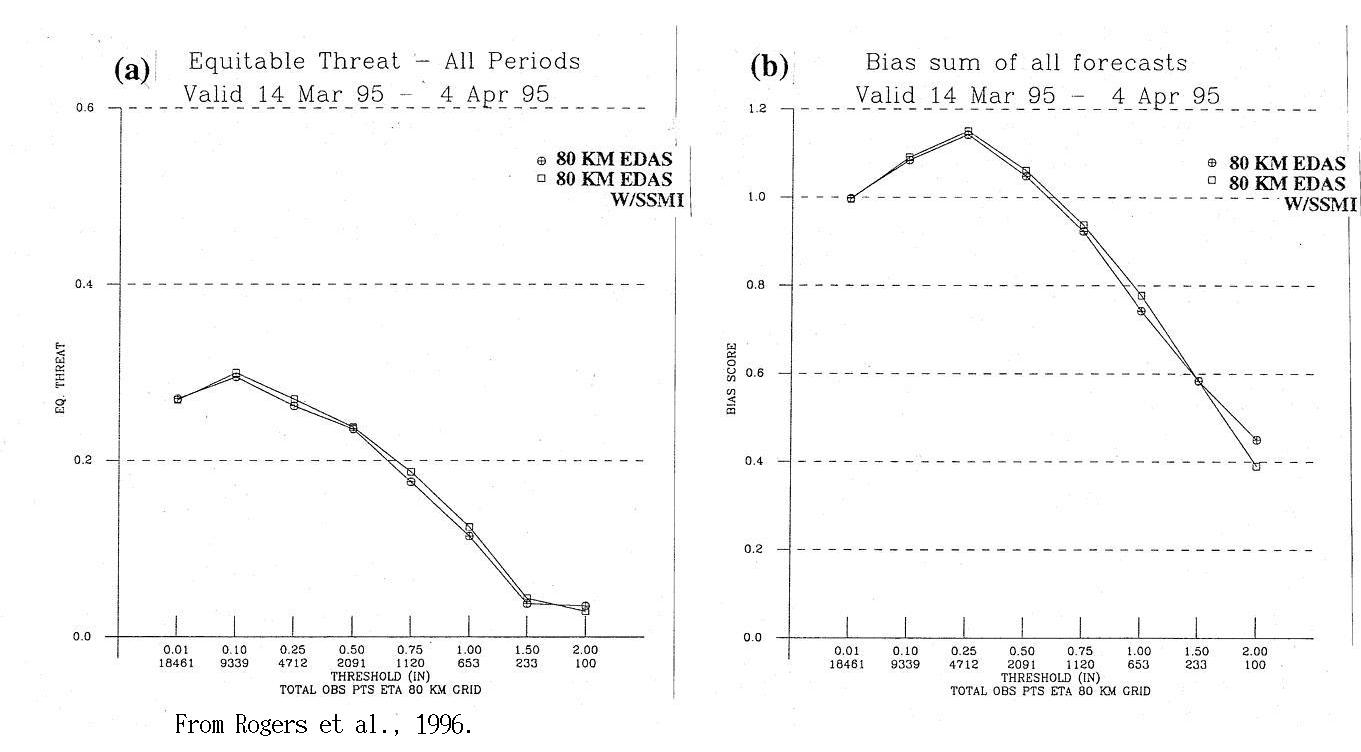
- used satellite-based total column water vapor information in the 3-hourly OI analysis (Lin, 1995. QPF scores).
12Z 31 Jan 1996:
Added modern multi-layer soil/vegetation/snowpack model
12Z 18 Feb 1997:
This "bundle" of changes are described in Black (1997. QPF scores for the parallel test).
12Z 9 Feb 1998:
12Z 3 Jun 1998:
- grid resolution increased from 48km/38-level to 32km/45-level (QPF scores for the parallel test).
- Soil layers increased from 2 to 4
- Eta OI analysis replaced by Eta based 3D variational analysis (3DVAR) (QPF scores for the parallel test).
- "Partially cycled" EDAS: rather than starting each cycle of EDAS entirely the first guess obtained from the global model, we now obtain soil moisture/temperature, cloud water and TKE from the previous EDAS cycle.
References: Rogers et al., 1996, 1997.
12Z 3 Nov 1998:
Changes to the 3DVAR analysis were made to improve the analysis of surface and lower tropospheric data, particularly moisture. During the winter of 1998-99 it became apparent that the Eta model forecasts had decreased skill from the previous winter (Rogers, 1999):12Z 13 May 1999:
QPF scores for 1 Dec 1997 - 28 Feb 1998
QPF scores for 1 Dec 1998 - 28 Feb 1999
After extensive tests, the problem in the 3DVAR analysis implemented in the previous November was fixed (Rogers, 1999. QPF scores shown here).27 Sep 1999, Cray90 outage:
C90 was damaged by a fire on the afternoon of 27 Sep. Currently only the 80-km Eta (from static analysis) is being produced at 00Z and 12Z.References:Impact to the QPF due to the production model downgrade (the degradation in the Eta threat scores after September can be seen in the now-smaller advantage Eta has over the AVN and NGM models):
QPF scores for Sep 1999 (90% of cycles are from 32km ETA/EDAS)
QPF scores for 1-21 Oct 1999 (from 80km static ETA)
Black,T, M. Baldwin, K. Brill, F. Chen, G. DiMego, Z. Janjic, G. Manikin, F. Mesinger, K. Mitchell, E. Rogers, and Q. Zhao, 1997: Changes to the Eta forecast systems. Technical Procedures Bulletin, No. 441, NOAA/NWS, [National Weather Service, Office of Meteorology, 1325 East-West Highway, Silver Spring, MD 20910]. On-line versionBlack, T., 1994: The new NMC mesoscale Eta model: description and forecast examples. Wea. Forecasting, 9, 265--278.
Lin, Y., K.E. Mitchell, E. Rogers and G.J. DiMego, 1995: Impact of satellite moisture observations on forecasts made by NMC's Eta model. Preprints, 14th Conf on Weather Analysis and Forecasting, Dallas, TX, Amer. Meteor. Soc., 301-302.
Rogers, E., D. Parris and G. DiMego, 1999: Changes to the NCEP operational Eta Analysis. Technical Procedures Bulletin, No.*** (not yet numbered), NOAA/NWS. [ National Weather Service, Office of Meteorology, 1325 East-West Highway, Silver Spring, MD 20910 ]. On-line version
Rogers, E., M. Baldwin, T. Black, K. Brill, F. Chen, G. DiMego, J. Gerrity, G. Manikin, F. Mesinger, K. Mitchell, D. Parrish, Q. Zhao, 1997: Changes to the NCEP Operational "Early" Eta Analysis/Forecast System. Technical Procedures Bulletin No. 447, NOAA/NWS. [ National Weather Service, Office of Meteorology, 1325 East-West Highway, Silver Spring, MD 20910 ]. On-line version
Rogers, E., D. Parrish, Y. Lin and G.J. DiMego, 1996: The NCEP Eta data assimilation system: tests with a regional 3-D variational analysis and continuous cycling. Preprints, 11th AMS Conference on Numerical Weather Prediction, Norfolk, VA, 19-23 August 1996.
Rogers, E., T. L. Black, D. G. Deaven, G. J. DiMego, Q. Zhao, M. Baldwin, N. W. Junker and Y. Lin, 1996: Changes to the operational ``Early'' Eta analysis/forecast system at the National Centers for Environmental Prediction. Wea. Forecasting, 11, 391--413.
Rogers, E., D. Deaven and G. J. DiMego, 1995: The regional analysis system for the operational "early" Eta model: original 80-km configuration and recent changes. Wea. Forecasting, 10, 810--825.
Zhao, Q., T.L. Black and M.E. Baldwin, 1997: Implementation of the cloud prediction scheme in the Eta model at NCEP. Wea. Forecasting, 12, 697--711.