An Alternative Approach to Nonhydrostatic Modeling,
Part III: Nonlinear Mountain Wave Test
Z.I. Janjic1), J.P. Gerrity, Jr.1)
and S. Nickovic2)
As
yet another test of the soundness of our nonhydrostatic formulation, we
performed a nonlinear mountain wave experiment similar to that of Bubnova et
al. (1995). The experimental set-up
involves a “bell shaped” hill of 400 m
height and 400 m half-width. The initial horizontal wind was set to 4 ![]() and the temperature
was set to provide a Brunt‑Vaisala stability parameter N approximately equal to
and the temperature
was set to provide a Brunt‑Vaisala stability parameter N approximately equal to ![]() . The horizontal grid
size was 80 m covering a domain of 16
km.
The pressure at the top was set to 340 hPa, and the sea level pressure was set to
. The horizontal grid
size was 80 m covering a domain of 16
km.
The pressure at the top was set to 340 hPa, and the sea level pressure was set to ![]() . The height of the
model’s atmosphere was about 8 km. The vertical coordinate used 80 layers of
equal mass (constant
. The height of the
model’s atmosphere was about 8 km. The vertical coordinate used 80 layers of
equal mass (constant ![]() ) which provides about 100 m vertical spacing on the
average. The time step was again
) which provides about 100 m vertical spacing on the
average. The time step was again ![]() . Over the elevated
topography, the surface pressure was computed initially using the hypsometric
equation and the assigned horizontally homogeneous, thermal profile. However, there were differences in the
treatment of the lateral boundary conditions compared to the test by Bubnova et
al. (1995). Instead of the
Davies-Kallberg relaxation (Davies, 1976), the periodicity was required, and,
in addition to that, the Rayleigh damping was applied with the weight
proportional to
. Over the elevated
topography, the surface pressure was computed initially using the hypsometric
equation and the assigned horizontally homogeneous, thermal profile. However, there were differences in the
treatment of the lateral boundary conditions compared to the test by Bubnova et
al. (1995). Instead of the
Davies-Kallberg relaxation (Davies, 1976), the periodicity was required, and,
in addition to that, the Rayleigh damping was applied with the weight
proportional to
![]() for
for ![]() .
.
Here, d is
the distance of the grid point from the point located at zero height in the
middle of the integration domain in the direction of the x axis. The maximum
distance ![]() is defined as the
distance of the uppermost point at the left boundary from this point. In the semi-circular domain
is defined as the
distance of the uppermost point at the left boundary from this point. In the semi-circular domain ![]() the damping is not
applied, while in the rest of the integration domain it operates with the
intensity increasing with distance, as described by the formula. In the main test
the damping is not
applied, while in the rest of the integration domain it operates with the
intensity increasing with distance, as described by the formula. In the main test ![]() was set to 7000 m, and for the maximum distance, the
weight reached the maximum of 0.03.
With this arrangement, the Rayleigh damping was applied at the lateral,
as well as at the upper boundary. In
the tests of Bubnova et al. (1995), this technique was applied only at the
upper boundary, starting from rather low 5600 m.
was set to 7000 m, and for the maximum distance, the
weight reached the maximum of 0.03.
With this arrangement, the Rayleigh damping was applied at the lateral,
as well as at the upper boundary. In
the tests of Bubnova et al. (1995), this technique was applied only at the
upper boundary, starting from rather low 5600 m.
The
divergence damping was not used and there was no time filtering of the basic
variables. However, the diffusion
coefficients along the x and ![]() axes were,
respectively, 0.001 and 0.0003 for u,
0.010 and 0.0 for T, and 0.0 and 0.0
for w.
axes were,
respectively, 0.001 and 0.0003 for u,
0.010 and 0.0 for T, and 0.0 and 0.0
for w.
The
deviation of the horizontal wind from the basic state after 2 hours is shown in
Fig. 1 with the contour interval of 0.4 ![]() . As in Bubnova et al
(1996) figures, the hill is positioned 3.6 km
from the left border of the figure, which covers a total width of 11.4 km.
The vertical extent of the figure is 7 km. The dashed contours
indicate negative values. As can be
seen from the figure, the solution is marked by the slanted upward propagation
of the perturbation away from the obstacle, as one would expect. The result shown in Fig. 1 is similar to that
obtained by Bubnova et al. (1995).
However, because the solutions are of finite amplitude and nonlinear,
verification against known exact solutions is not possible. The observed differences between the
numerical solutions can be explained by different lateral and upper boundary
conditions, and different damping parameters and procedures. In the flow regimes considered here, the
solutions are very sensitive to both boundary condition specification and
damping. This aspect of the problem
requires further study that goes beyond the scope of the present research.
. As in Bubnova et al
(1996) figures, the hill is positioned 3.6 km
from the left border of the figure, which covers a total width of 11.4 km.
The vertical extent of the figure is 7 km. The dashed contours
indicate negative values. As can be
seen from the figure, the solution is marked by the slanted upward propagation
of the perturbation away from the obstacle, as one would expect. The result shown in Fig. 1 is similar to that
obtained by Bubnova et al. (1995).
However, because the solutions are of finite amplitude and nonlinear,
verification against known exact solutions is not possible. The observed differences between the
numerical solutions can be explained by different lateral and upper boundary
conditions, and different damping parameters and procedures. In the flow regimes considered here, the
solutions are very sensitive to both boundary condition specification and
damping. This aspect of the problem
requires further study that goes beyond the scope of the present research.
Finally,
the evolution over the 2 hour forecast period of the momentum flux normalized
by its low level value is presented in Fig. 2.
The sigma level is on the abscissa, and the flux profiles after,
respectively, 1800 s, 3600 s, 5400 s and 7200 s are marked
by filled circles, filled diamonds, empty circles and empty diamonds. As pointed out by Bubnova et al. (1995), the
profiles oscillate with height, with the values slowly increasing in time. The growth rate, however, appears to be
becoming very slow by the end of the forecast period.
_________________________________________________
1) NCEP/EMC,
5200 Auth Rd., Camp Springs, MD 20746
2) University of
Athens, Greece and ICoD, University of Malta, Valetta
e-mail: zavisa.janjic@noaa.gov
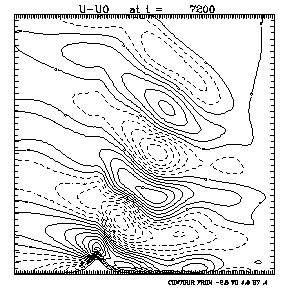
Fig. 1. The
deviation of the horizontal wind from its initial uniform value (![]() ) after 2 hours. The
hill is positioned 3.6 km from the
left border of the figure, which covers a total width of 11.4 km.
The vertical extent of the figure is 7 km. The contour interval is 0.4
) after 2 hours. The
hill is positioned 3.6 km from the
left border of the figure, which covers a total width of 11.4 km.
The vertical extent of the figure is 7 km. The contour interval is 0.4 ![]() and the dashed
contours indicate negative values.
and the dashed
contours indicate negative values.
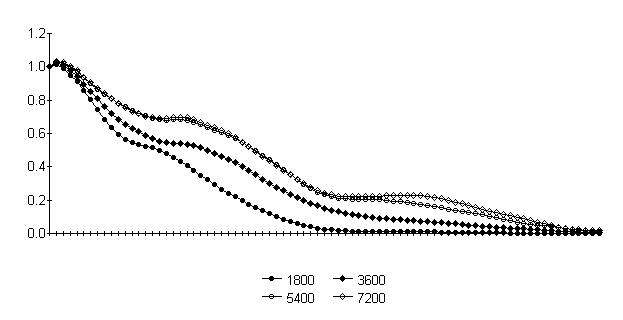
Fig. 2. Evolution over 2 hours of the momentum flux
normalized by its low level value. The
sigma levels are on the abscissa. The
flux profiles after, respectively, 1800 s,
3600 s, 5400 s and 7200 s are marked
by filled circles, filled diamonds, empty circles and empty diamonds.
REFERENCES
Bubnova, R., G. Hello, P. Benard and J‑F Geleyn, 1995: Integration of the fully elastic equations cast in the hydrostatic pressure terrain‑following coordinate in the framework of the ARPEGE/Aladin NWP system. Mon. Wea. Rev., 123, 515‑535.
Davies, H.C., 1976: A lateral boundary formulation for multi‑level prediction models. Quart. J. Roy. Meteor. Soc. 102, 405‑418.