MONITORING OF RADIOSONDE HEIGHTS AND TEMPERATURES BY THE COMPLEX QUALITY CONTROL FOR THE NCEP/NCAR REANALYSIS
William G. Collins
National Centers for Environmental Prediction/Environmental Modeling Center
W/NP22, Room 204 WWB, Washington, DC20233
E-MAIL:William.Collins@noaa.gov
A. NUMBERS OF REPORTS AVAILABLE TO REANALYSIS
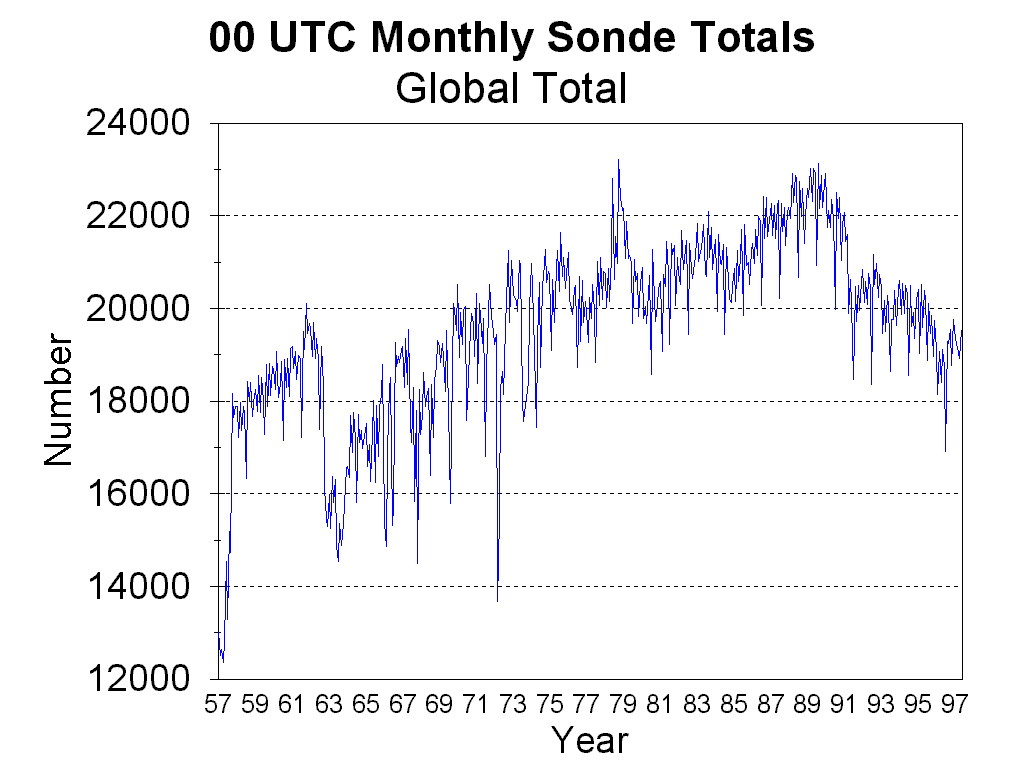
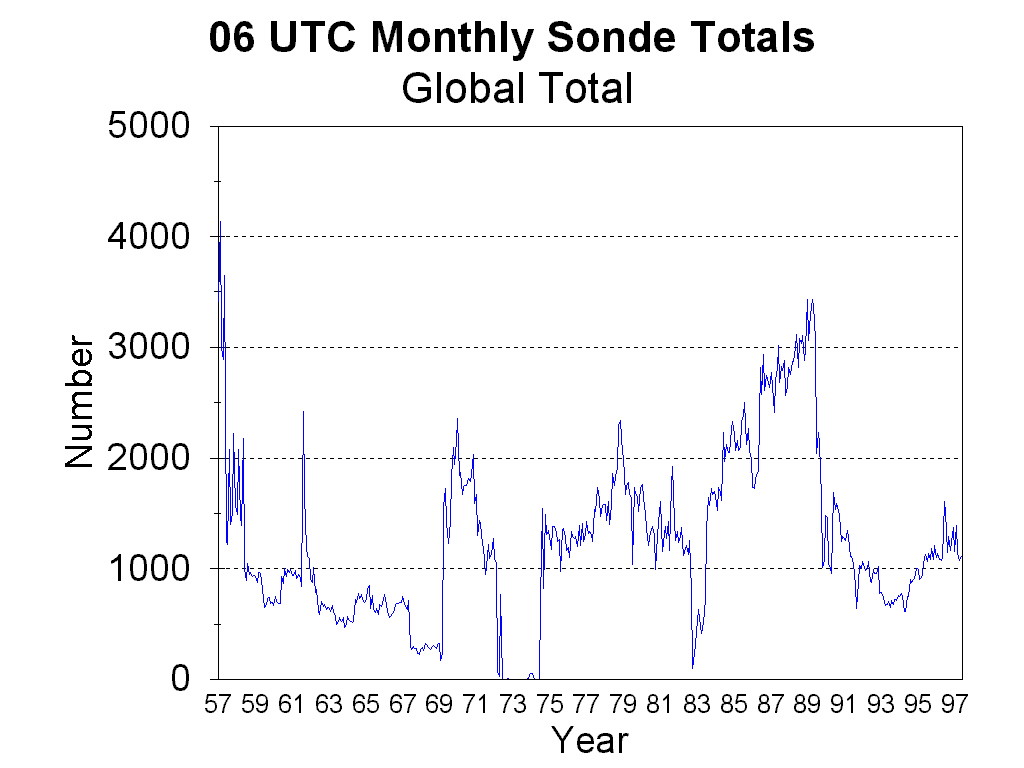
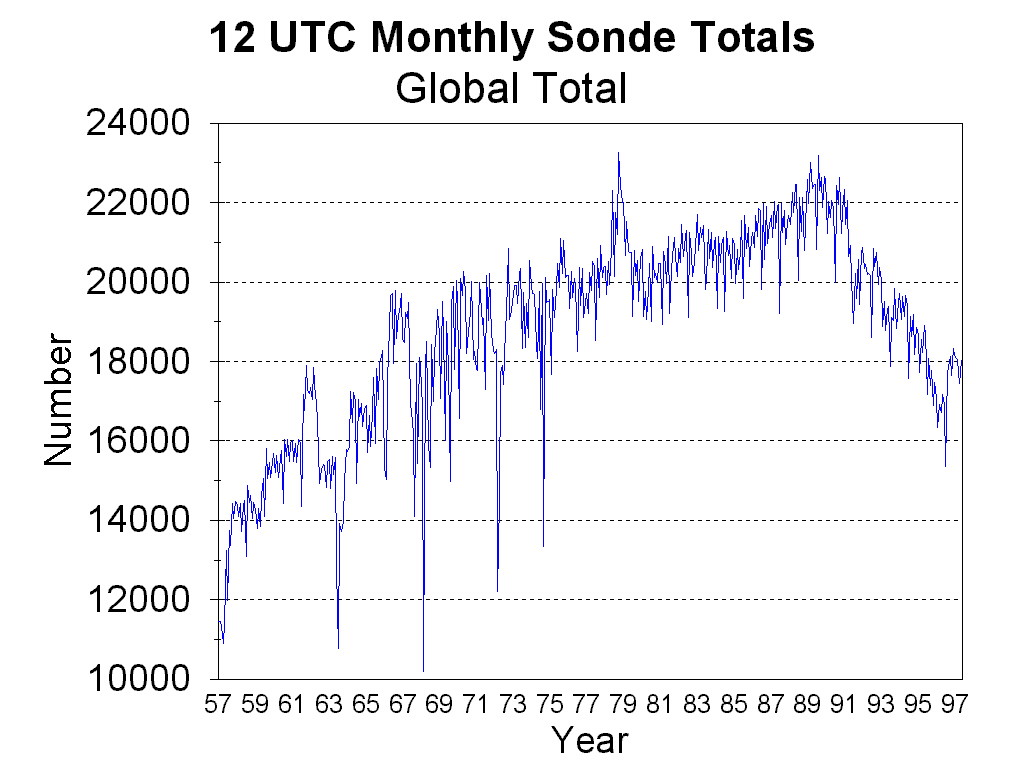
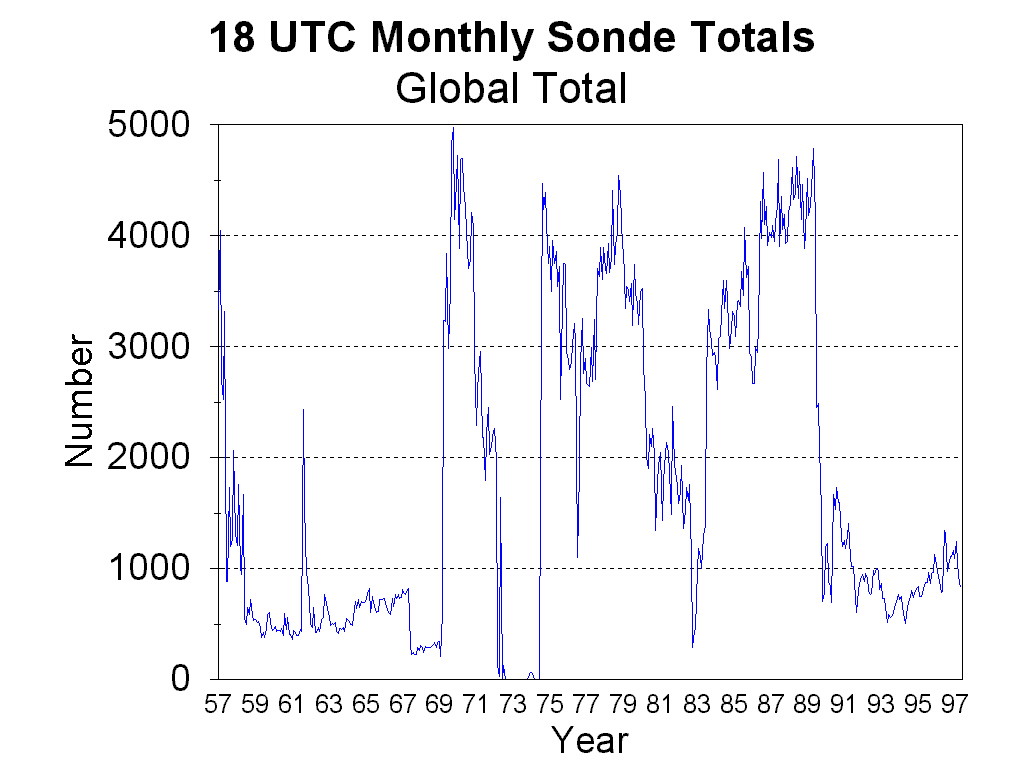
The 40-year period, August 1958 through December 1997 is covered by the results of this poster. Most observations were at 00 and 12 UTC. The global monthly totals of radiosonde reports for each of the four main observation times are shown in the figures that follow. 00 UTC, 06 UTC, 12 UTC and 18 UTC
There is a general increase in radiosonde reports from 1958, until a sharp decrease in May 1963. This decrease is not shared by all regions, but is dominated by decreases in the former USSR, China and other regions. For some reason, this decrease is much larger at 00 UTC than at 12 UTC. There is a temporary sharp temporary decrease, for 00 and 12 UTC, in January 1973. This is associated with the introduction of O.N. 29 data format at NCEP. Also, in January 1973, the 06 and 18 UTC counts drop to 0 and remain near there for 2 years, likely indicating procedural problems associated with the change to O.N. 29.
The counts at 06 and 18 UTC are erratic, changing most often due to the rapid increase or decrease within a single or few regions. The largest count in a month is about 5000, while the maximum count at 00 and 12 UTC reaches over 23,000.
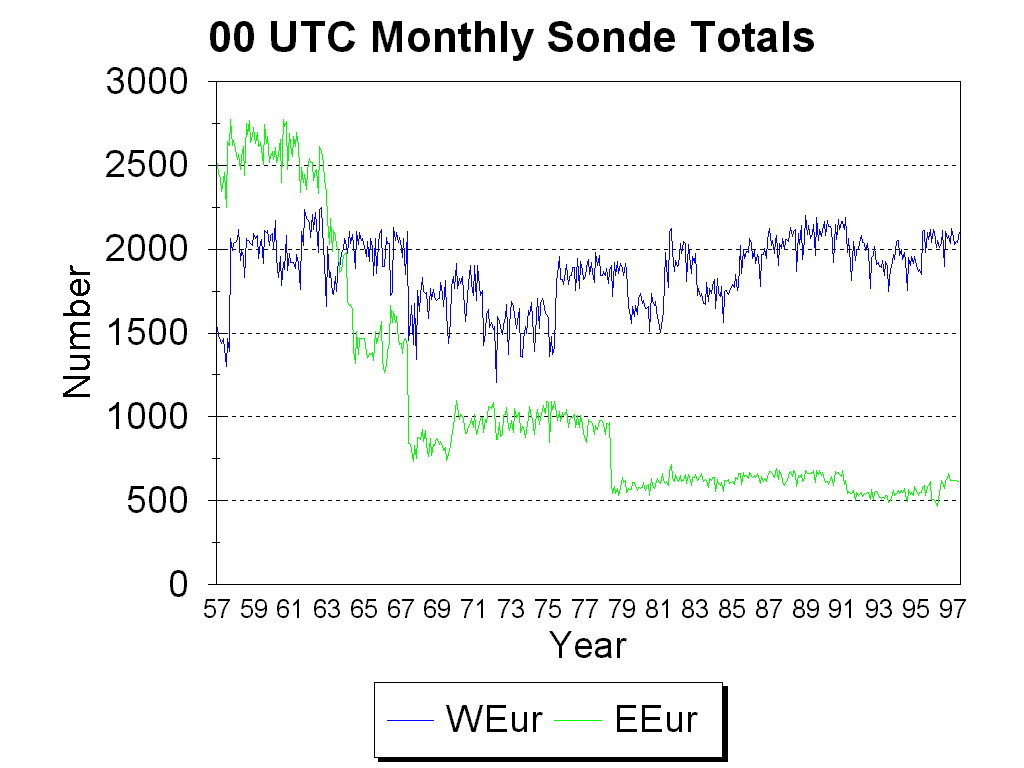
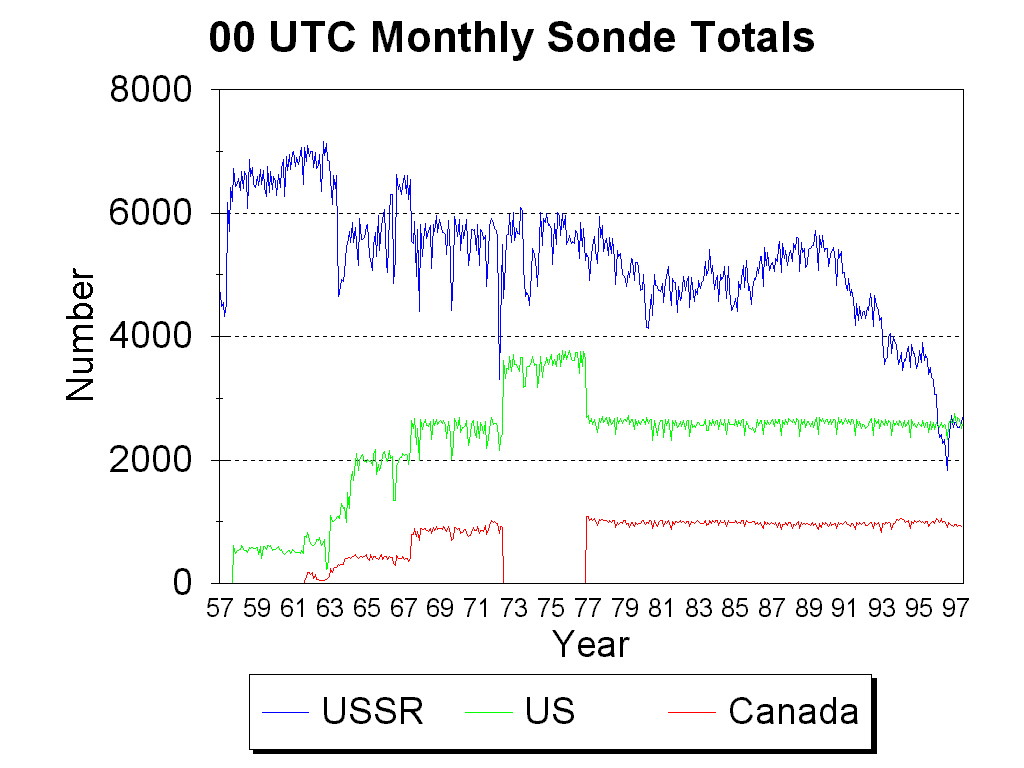
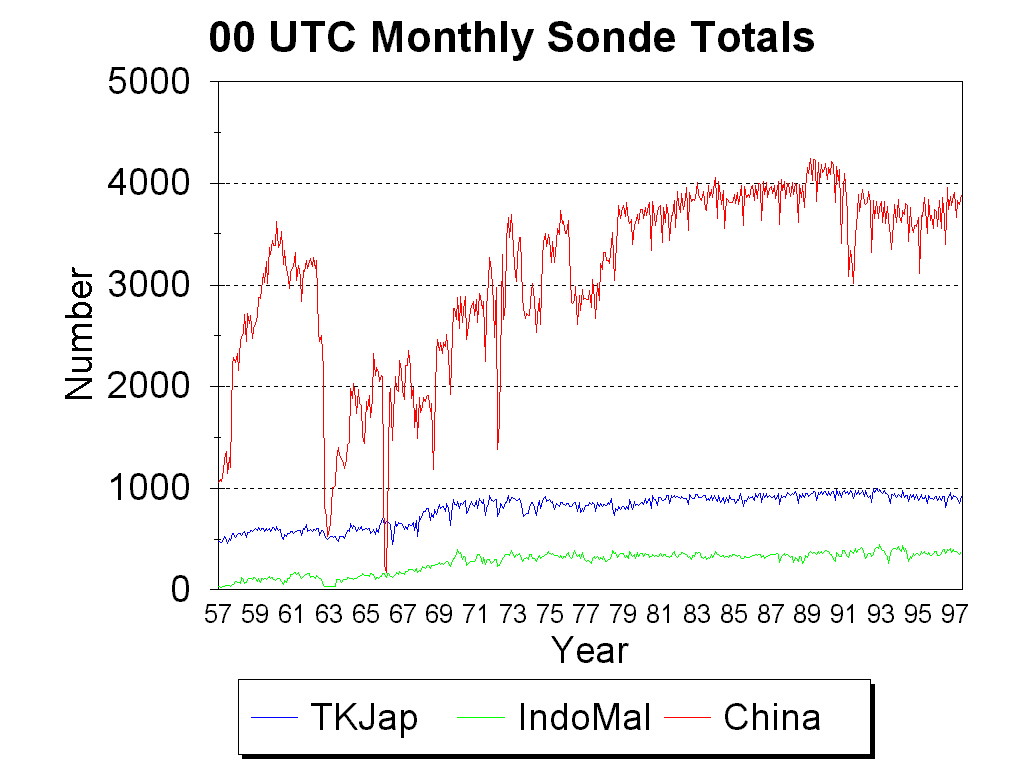
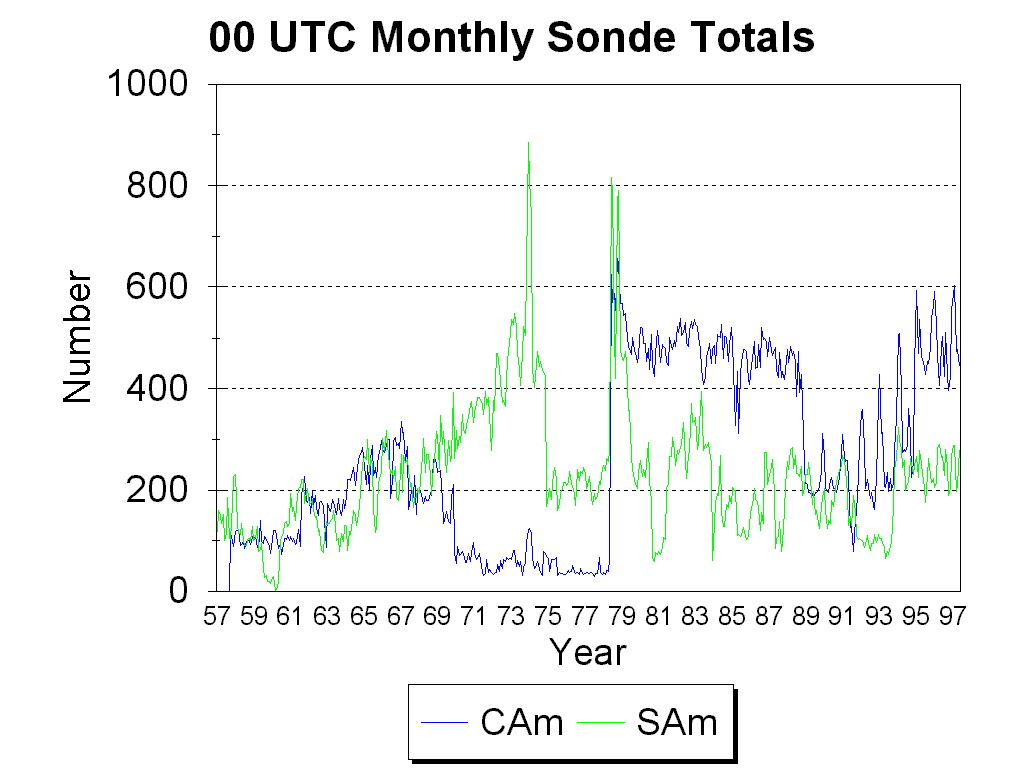
B. REGIONAL MONTHLY TOTALS OF RADIOSONDE REPORTS
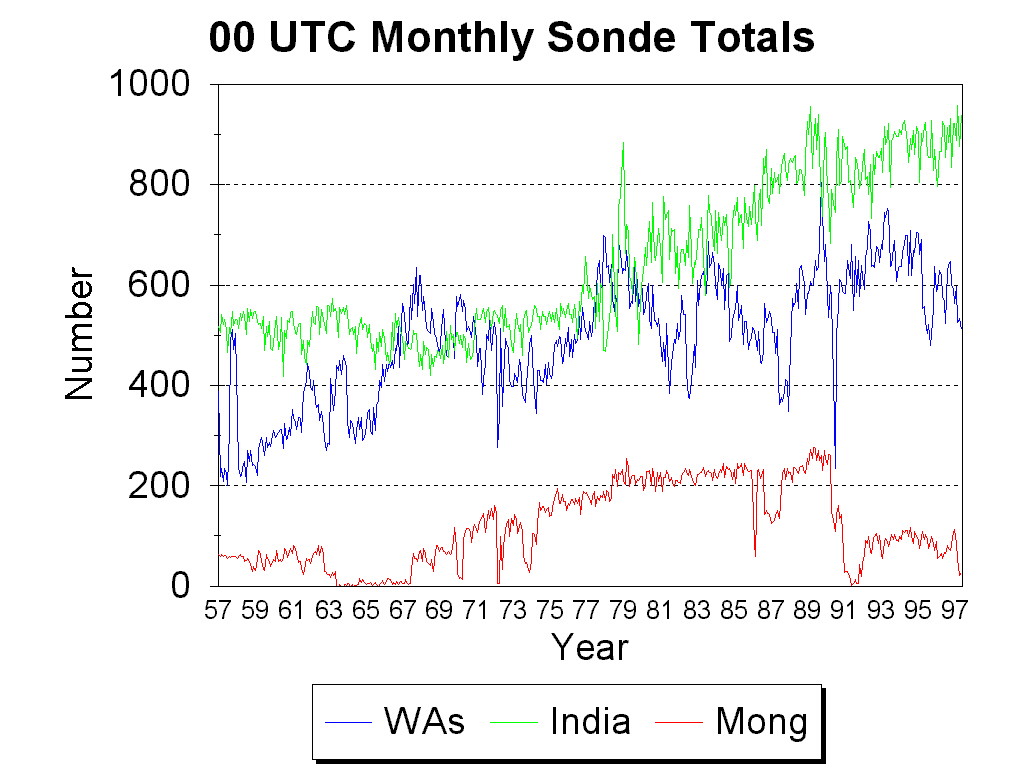
The regional monthly totals of radiosonde reports available to the Reanalysis at 00 UTC are displayed in following graphs. The regions are chosen to be large enough to have a significant number of observations, are roughly similar, and are geographically proximate. The regions are:
|
Name |
Region |
WMO Blocks |
|
WEur |
Western Europe |
1-8,10,16 |
|
EEur |
Eastern Europe |
9,11-15,17 |
|
USSR |
Former USSR |
20-38 |
|
WAs |
Western Asia |
40-41 |
|
India |
India, Ceylon |
42-43 |
|
Mong |
Mongolia |
44 |
|
TKJap |
Taiwan, Korea, Japan |
45-47 |
|
IndoMal |
Indochina, Malaysia |
48 |
|
China |
China |
50-59 |
|
NCAf |
North and Central Africa |
60-65,67 |
|
SAf |
South Africa |
68 |
|
US |
United States |
70,72,74 |
|
Canada |
Canada |
71 |
|
CAm |
Central America |
76,78 |
|
SAm |
South America |
80-88 |
|
Ant |
Antarctica |
89 |
|
Pac |
Pacific |
91,96-98 |
|
AusNZ |
Australia, New Zealand |
93-94 |
Eur at 00UTC, US at 00 UTC, china at 00 UTC, africa at 00 UTC, central/south america at 00 UTC, asia at 00 UTC and asia at 00 UTC
Some of the regional data count changes are of interest. When the changes are shared by most regions, then it may be safely assumed that the reason is to be found in alteration to the data receipt, handling, decoding or other process at NCEP. When the changes are found only at one or several regions, then the reason may be otherwise. As an example, the 00 UTC monthly data counts for China mirror closely the global changes. In particular, there is a sharp decrease in May 1963, with the numbers not recovering for 10 years. Another large region, USSR, had a decrease from about 7000 to 5000, with rapid recovery to about 5800 or more. At the same time, the U.S. showed an increase over a one-year period from about 500 to about 2000, and Northern and Central Africa showed a sharp increase from less than 200 to about 350. Other regions show no significant change at that time. While the reasons for these changes is unknown, they seem to be orchestrated in some way beyond individual regions.
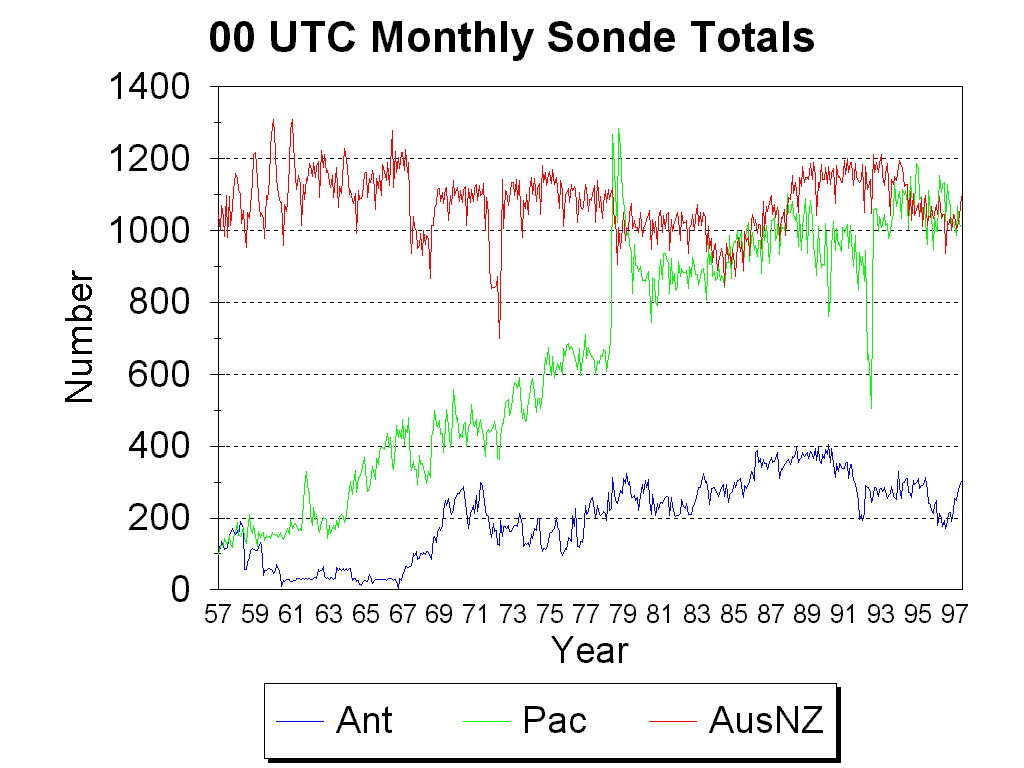
Some regional data counts show an annual variation, particularly at 06 and 18 UTC. Some annual variation is shown above for 00 UTC for the Antarctic, Pacific, and Australia/New Zealand regions. The reason is fairly obvious for the Antarctic, but less clear for other regions.
C DESCRIPTION OF COMPLEX QUALITY CONTROL OF RADIOSONDE HEIGHTS AND TEMPERATURES
The philosophy of Complex Quality Control (cqc) is to compute the result of several checks and only then make decisions regarding the data. Erroneous data may be: 1) rejected, 2) marked for dimished use, or 3) corrected. This poster describes the overall information gleaned from the cqc of radiosonde heights and temperatures (cqcht) by the NCEP/NCAR Reanalysis. The checks are described in the following table, where the residual is the result of each check.
|
CHECK NAME |
APPLIED TO |
RESIDUAL |
|
HYDROSTATIC |
Each layer between neighboring "complete" mandatory surfaces, i.e. surfaces with neither height nor temperature missing. |
Difference between the layer thickness computed from heights of its boundaries and that hydrostatically computed from their temperatures. |
|
BASELINE |
Layer between the station level (zs) and lowest reported mandatory surfaces. |
Difference between zs in station dictionary and zs hydrostatically computed from surface pressure ps and heights z1 and z2 of lowest reported surfaces. |
|
INCREMENTAL |
Reduced mean sea level pressure, temperature and height of all mandatory surfaces. |
Difference between the reported value and its 6-hr forecast value (called increment) |
|
HORIZONTAL |
Reduced mean sea level pressure, temperature and height of all mandatory surfaces. |
Difference between the increment and its value optimally interpolated horizontally. |
|
VERTICAL |
Temperature and height of all mandatory surfaces. |
Difference between the increment and its value optimally interpolated vertically. |
The cqcht collects information from each run on the radiosonde information available and on every error encountered. This poster shows selected results from both. The major correctable error types are listed below. In addition, observation errors are not correctable.
|
TYPE |
VARIABLE |
|
1 |
Communication error to single height |
|
2 |
Communication error to single temperature |
|
3 |
Communication error to height and temperature at the same level |
|
4 |
Communication error to z and/or T at the lowest level |
|
5 |
Communication error to z and/or T at the highest level |
|
6 |
Computation error between two levels |
|
7 |
Communication errors to heights at adjacent vertical levels |
|
8 |
Communication errors to temperatures at adjacent vertical levels |
|
9 |
Communication errors to z and T at adjacent vertical levels |
|
10 |
Communicaiton errors to T and z at adjacent vertical levels |
|
13 |
Data hole including 100 hPa surface |
|
14 |
Data hole not including 100 hPa surface |
|
others |
Other types of lesser importance |
D HISTORY OF ERRORS DETECTED BY CQCHT FOR THE REANALYSIS
The largest number of errors are for single-level, isolated heights and temperatures (error types 1 and 2). The monthly count of these errors is shown in the following figure. Note the large increase in August 1973, at the same time as the introduction of O.N. 29 data format at NCEP for radiosonde data. It is remarkable that the level of these errors takes over a decade to return to earlier levels. It should be noted, however, that the absolute number of errors is small.
The next most frequent errors are to height and temperature at the same level (type 3), errors at the lowest level (type 4), and errors at the top level (type 5). The monthly count of these errors is shown in the following figures. type 1,2 errors and type 3,4,5 errors
The peak in type 5 error is common to many regions, and therefore probably due to a problem in the data collection, ending at NCEP. Other peaks show mostly with a single or few regions. Some of the more dramatic short-term increases for individual regions or groups of regions are illustrated in the following plots. It is rare for the reason to be known. india, type 1,2 errors and india, type 3,4,5 errors
While the global number of errors of type 1-5 is generally decreasing, the count is constant or increasing for India. Substantial work to determine the cause has not led to a solution. As a result, many operational weather centers do not attempt to use these data. Because of the cqcht, both the Reanalysis and the operations at NCEP allow what remains of these data to be used after correction and rejection.
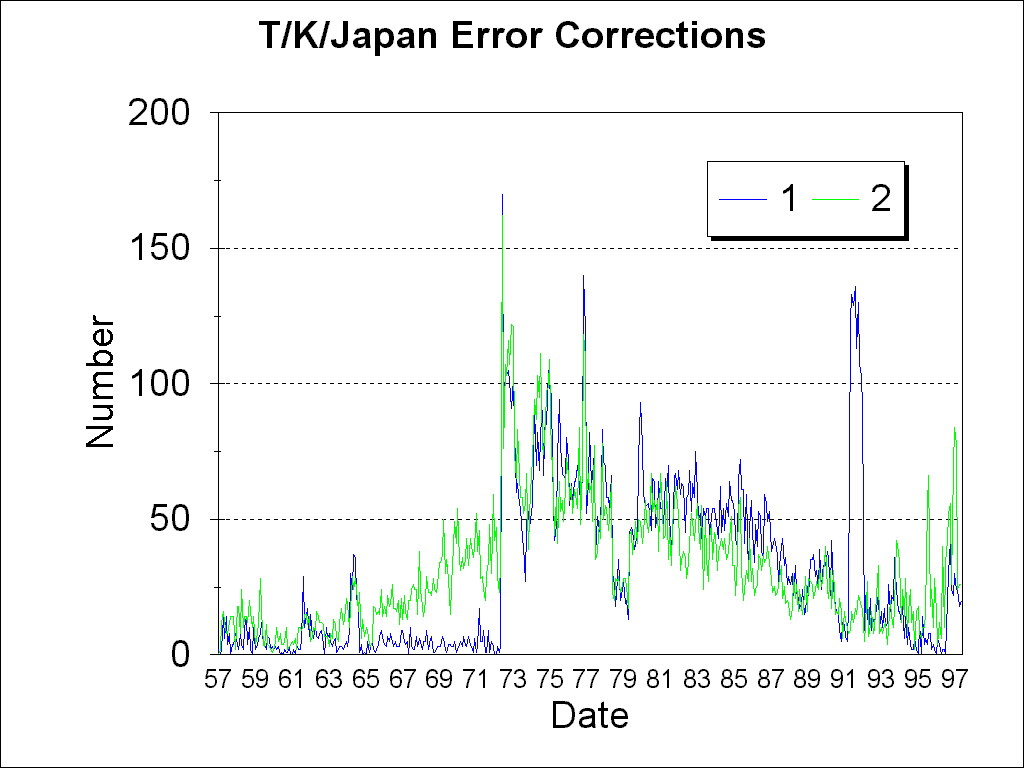
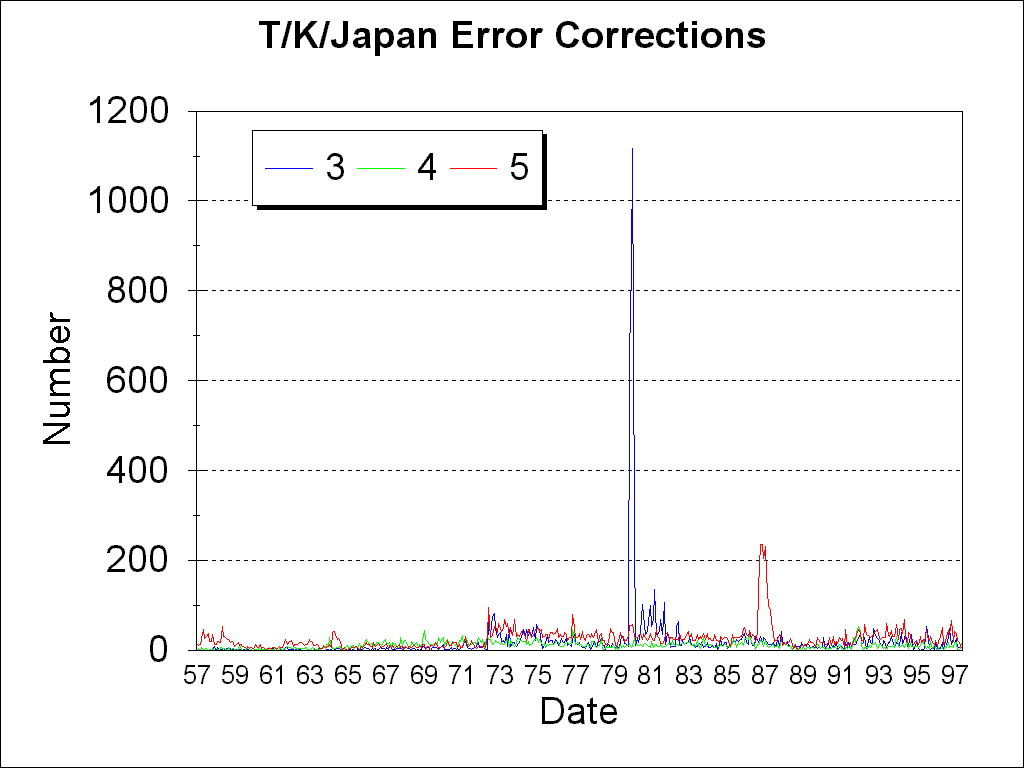
The monthly error counts from Taiwan/Korea/Japan show sharp, isolated peaks. There is a peak in isolated height errors in 1991, and a peak in height and temperature errors at the same level in August 1980. This peak is almost 10 times in magnitude that of any other months. The reason is unknown. There is also a sharp maximum in errors at the top level in August 1987. Taiwan/Korea/Japan type 1,2 errors and Taiwan/Korea/Japan type 3,4,5 errors
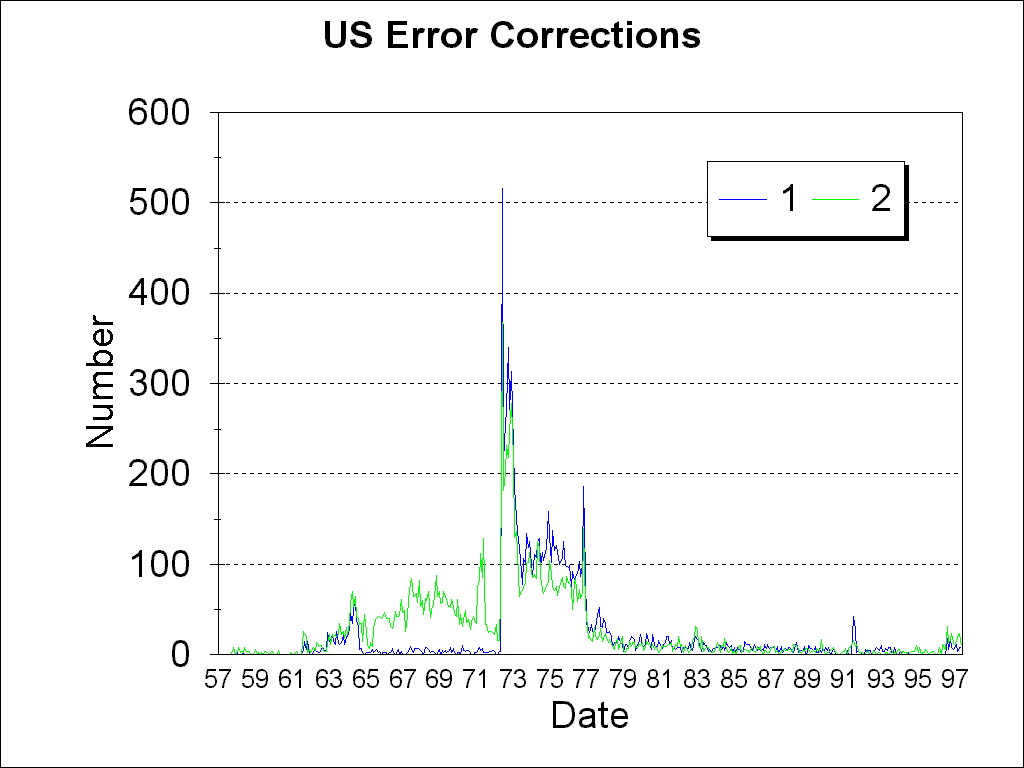
The U.S. errors show some interesting jumps and peaks. In 1964, the single-level height errors show a significant decrease, at the same time as the introduction of a new data format (O.N. 20) at NCEP, and perhaps new quality control procedures. For a few years, from 1973 to 1976, the Canadian radiosondes, for an unknown reason, were given a block 72 designation, and therefore their errors were counted with the U.S. errors. This began at the same time as the introduction of the O.N. 29 data format, and may be related. Type 3 errors show a significant peak (2500 errors in 1 month!) in July 1983, with unknown reason. The peak in top level errors in August 1987 is shared by many other regions. U.S. type 1,2, errors and U.S. type 3,4,5 errors
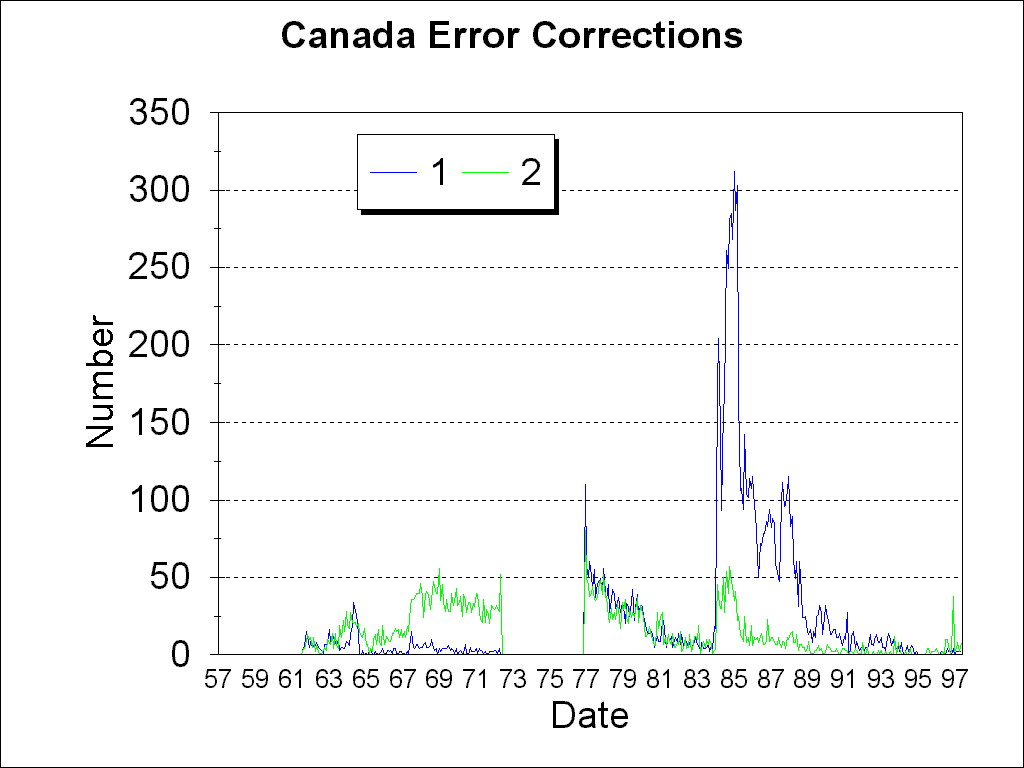
The monthly error counts for Canada clearly show the gap when they were counted with the U.S. counts. There is a sharp increase in single level height errors and errors at the top level for a perio beginning in about 1984. These were due to a code problem in the Canadian automated processing at each station with the new system. Routine monitoring by cqcht's early version helped in part to diagnose this problem. Canada type 1,2, errors and Canada type 3,4,5 errors
Not shown, China shows some periods with excessive error counts. The most distinctive is the short-term increase for January-February 1965. This increase is shared by most error types. This spike increase for several error types is also shared by South Africa and is probably no accident that this happens also at the same time that several error types for India show a step increase. There are other spikes for individual error types that are of less interest. The count of "holes" (types 13 and 14) detected for China is very high for some time periods: late 1950s to 1963 and early 1970s, with counts a high as 1800 in a month.
REFERENCES
Collins, W.G. and L.S. Gandin, 1990: Comprehensive hydrostatic quality control at the National Meteorological Center. Mon. Wea. Rev., 118, 2754-2767.
Collins, W.G., 1992: Complex quality control of rawinsonde heights and temperatures CQCHT) at the National Meteorological Center, Office Note 390. [Available from NCEP, 5200 Auth Road, Washington, DC 20233.]
Gaffen, D., 1993: Instruments and observing methods: historical changes in radiosonde instruments and practices. WMO Instruments and observing methods Report No. 50 (WMO/TD-No. 541),123 pp.
Gandin, L.S., 1983: Complex quality control of meteorological observations. Mon. Wea. Rev., 116,1137-1156.
Kalnay, E., et al, 1996: The NCEP/NCAR 40-year Reanalysis Project. Bull. Amer. Meteor. Soc.,77,437-471.