William G. Collins
National Meteorological Center
Washington, D.C.
(13'th Conference on Weather Analysis and Forecasting, Vienna, VA, Aug. 2-6, 1993)
1. INTRODUCTION
A program for the quality control of
doppler wind profiler data is under development at the National Meteorological
Center. It uses the principles of Complex Quality Control (CQC) (Gandin,
1988). CQC recognizes that the most precise decisions may be made only
after collecting and quantifying as complete information as possible. A
CQC algorithm uses two main parts: 1) the computation of check residuals,
and 2) the Decision Making Algorithm (DMA), which makes the decisions regarding
data quality (or for some data types, even corrects bad data).
The CQC program discussed here is preliminary
and is not yet operational at the NMC. However, the main aspects are already
set. There are three checks used by the CQC for profilers (PRCQC). First
is the incremental check, where the increment is the difference between
the profiler wind component observation and a short (1-3 hour) forecast
from the Nested Grid Model data assimilation system. Second is the vertical
interpolation check using increments. And third is the temporal interpolation
check using increments. The temporal check uses data at the same level
from one or at most two hours ahead and behind. The residuals from the
checks are brought to a common base for comparison by dividing them by
the standard deviation of the residuals taken from a statistical sample.
The DMA uses the results of whichever
checks are available. In order to diagnose an error, it looks for two things:
1) sufficient size of the residuals, and 2) agreement among the residuals.
An observation is judged bad if the average of the residuals squared is
1.44 times the residual variances and the residuals are close enough together.
If the average of the residuals squared is between .64 and 1.44 times the
residual variances, the observation is judged to be questionable.
There is a preliminary quality control
of the wind profiler data at the Hub in Boulder, CO (Brewster, 1989), and
the PRCQC must be more accurate and reliable to be useful. Two checks are
used by the Hub: a shear (vertical) check and a median check (temporal
and vertical). The addition of the incremental check by the PRCQC is particularly
valuable. By waiting until 2 hours after data time for checking, the temporal
check should also be more accurate.
2. EXAMPLES
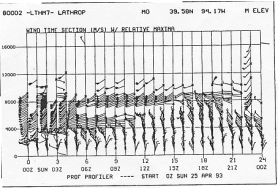
Fig. 1 shows the profiler winds for
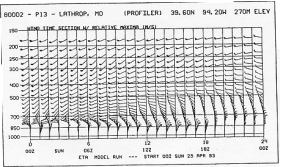
the Lathrop, MO site for 25 April 1993. Fig. 2 shows NMC's ETA model forecast
(easier to display than the Regional Data Assimilation forecasts beginning
from different times), beginning at 00Z and valid for the same period as
the profiler winds. At 23Z there are several upper level winds that are
erroneous. Only 1 was flagged by the Hub quality control while the lower
9 were flagged by PRCQC. The upper 6 were flagged by neither. The PRCQC
recognized that they did not match the guess well, but they were not far
off, and without corroboration from the other checks, they were judged
to be okay. Clearly, further tuning will further improve the performance.
There are several other isolated winds that are in error as well as several
winds at 2 and 3Z near 8 km height. A detailed comparison between the Hub
and PRCQC results was not made for these winds.

Fig. 1. Wind profiler observations for
Lathrop. MO. 00Z 25 April to 00Z 26 April 1993.

Fig. 2. ETA model
forecast winds for Lathrop, MO for 00Z 25 April to 00Z 26 April 1993.
Another example
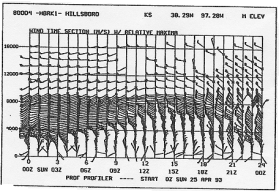
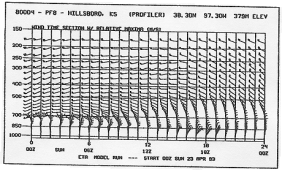
is provided by Hillsboro, KS, for 25 April 1993. Fig. 3 shows the profiler
observations and Fig. 4 shows the ETA model forecast winds valid at the
same times. There are several erroneous winds, particularly at 22-00Z.
At 22Z, the single bad wind at 2697m was detected only by PRCQC; the bad
wind at 8947m was found by both. At 232 there are several winds, between
7947 and 8947m, that are all bad. All were detected by PRCQC, but only
3 by the Hub quality control. In addition, the Hub flagged as bad the next
4 good winds above while the PRCQC did not. At 00Z the single bad wind
was detected by both.

Fig. 3. As for Fig. 1, but Hillsboro,
KS.

Fig. 4. As for Fig. 2, but for Hillsboro,
KS.
3. PRELIMINARY
STATISTICS OF OPERATION
While a complete
statistical analysis of the PRCQC decisions has not been made, a detailed
comparison was made for all decisions for 22Z 25 April 1993 to 00Z 26 April
1993 for 26 of the profiler sites. The decisions were compared against
each other and a subjective judgment was made of the correctness of each
automated decision. Table 1 shows some of the results.
Table 1. Hub and PRCQC decisions
| good Hub decisions | 63 |
| good PRCQC decisions | 123 |
| bad Hub decisions | 94 |
| bad PRCQC decisions | 18 |
| Hub decisions better than PRCQC | 9 |
| PRCQC decisions better than Hub | 81 |
| questionable Hub decisions | 14 |
| questionable PRCQC decisions | 30 |
| common bad decisions | 9 |
| total decisions compared | 171 |
In terms of percentages,
for this very limited sample, the Hub decisions were 37% good, 55% bad
and 8% questionable. For the PRCQC there were 72% good, 11% bad and 17%
questionable decisions. The difference in performance may be mostly attributed
to the use of the first guess by PRCQC. Another advantage is the use of
the CQC strategy which makes no decisions until the values of all check
residuals are available. The DMA itself is also critical. The version used
in these tests is fairly well developed, but further refinement is planned.
4. REFERENCES
Brewster. Keith
A., 1989: Profiler Training Manual #2. Quality control of wind profiler
data. Developed for the National Weather Service Office of Meteorology.
1-39.
Gandin, Lev S.,
1988: Complex quality control of meteorological observations. Mon.
Wea. Rev., 116 (5), 1138-1156.