NLDAS Drought Monitor
Soil Moisture
NOTE: This page is best viewed with a screen resolution of at least 1024x768
DISCLAIMER: Any data provided on this server should be used for research or educational purposes only.
This data should NOT be relied on for any operational use as data gaps can occur due to hardware
failure and/or model upgrading procedures.

Ensemble Mean LSM OUTPUT:
LDAS DROUGHT IMAGE
NOAH LSM OUTPUT:
MOSAIC LSM OUTPUT:
LDAS DROUGHT IMAGE LDAS DROUGHT IMAGE

SAC LSM OUTPUT:
VIC LSM OUTPUT:
LDAS DROUGHT IMAGE LDAS DROUGHT IMAGE

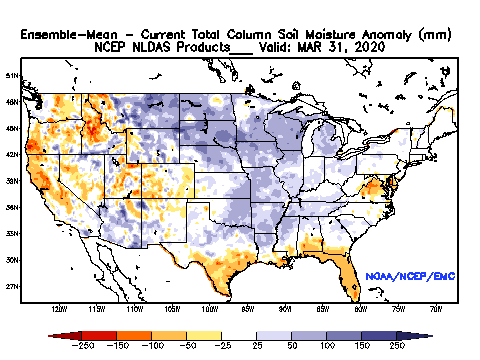
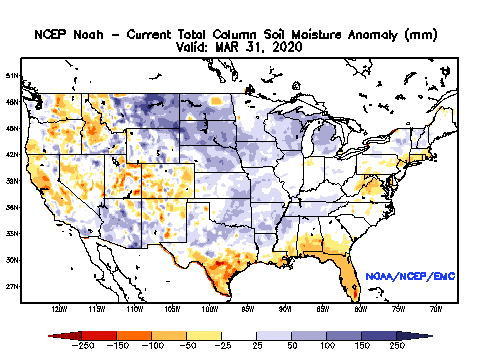
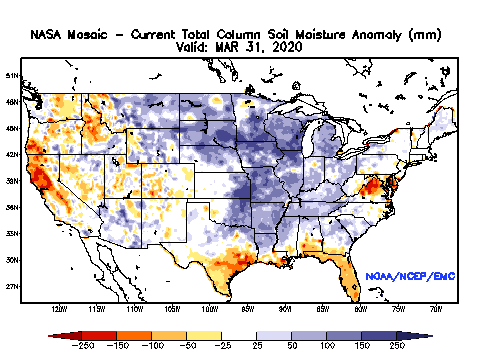
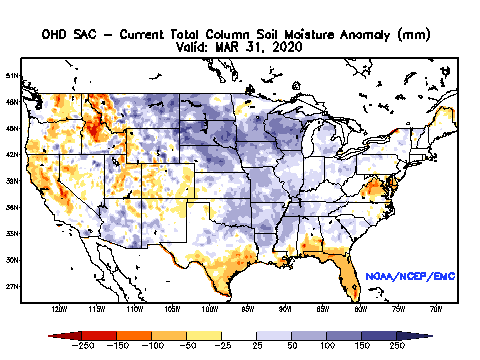
The NLDAS experimental drought monitor is derived from near real-time soil moisture output from both the NASA MOSAIC and NCEP Noah land surface models. The anomalies and percentiles are based on a 28 year climatology (1980 - 2007). Two separate climatology files are used; one for the calculation of anomalies, and one for the calculation of percentiles. The anomaly climatology file contains 1 soil moisture value per day (daily average over 28 years) for each gridbox. The percentile climatology file contains 140 soil moisture values per day (5 for each year) for each gridbox.

Anomalies are calculated by comparing the current soil moisture values to mean values for the same time of year over each gridbox. For weekly anomalies, the past week's worth of soil moisture values are first averaged together to form a single value. The same procedure is applied to the corresponding week of the anomaly climatology file. The two values are then differenced to derive an anomaly soil moisture value. A similar procedure is followed to compute monthly (30 day) anomalies.

Percentiles are based upon an 5 day moving window of soil moisture values. This acts to smooth out the soil moisture record. Weekly analyses for each gridbox are computed by comparing the past 7 days to corresponding period in the percentile climatology. Taking day 1 of the week as an example, hourly soil moisture values from this day are averaged together to form a single value. This value is then ranked against the soil moisture values from each day of the 5 day window surrounding day 1 of the corresponding week in the percentile climatology. This same process is then repeated for days 2-7 of the week, with each day of the week contributing equally to the overall ranking value. Monthly (30 day) percentile analyses are computed in a similar fashion.

Additional Drought Monitoring Links:
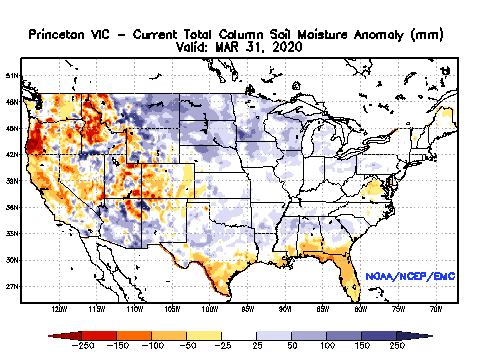
Drought Monitoring and Hydrologic Forecasting with VIC - Princeton University
Experimental Surface Water Monitor for the Continental U.S. - Washington University
Drought Monitoring Indices and Diagnostics from the North American Regional Reanalysis - NOAA CPC

Below are drought analysis plots from the National Drought Mitigation Center (Drought Monitor), and NOAA/NCEP's Climate Prediction Center (CPC).


Drought Monitoring at the National Drought Mitigation Center NDMC Drought Monitor

NOAA/NCEP Climate Prediciton Center Current Day Soil Moisture Anomaly (mm)
CPC's Soil Moisture Monitoring Page
CPC Current

This product is derived using CPC's one-layer soil moisture model. Maximum soil moisture capacity in the model is 760 mm (porosity of 0.47 => soil column depth of 1.6 m). Details about the model and its corresponding data sets can be found at :
http://www.cpc.ncep.noaa.gov/soilmst/descrip.shtml


NOAA webpage LDAS webpage NLDAS Web Page 
Developed and Maintained at NOAA/NCEP/EMC
Youlong.Xia@noaa.gov  
Jesse.Meng@noaa.gov
EMC webpage