 NARR
Based
NLDAS
Forcing
Dataset
Information
NARR
Based
NLDAS
Forcing
Dataset
Information
Forcing Files for NLDAS Phase 2 (NLDAS-2)
Version 1.0 - 17 December 2007
This document describes the contents of the forcing files for Phase 2 of
the National Land Data Assimilation System (NLDAS-2).
The spatial domain, spatial resolution, and computational grid, terrain
height and land mask of NLDAS-2 will be identical to that in NLDAS-1,
which is described in Section 2.1 of Mitchell et al. (2004, JGR, Vol. 109).
As in NLDAS-1, the temporal frequency of the NLDAS-2 land surface forcing
files will be hourly and the file format will be the WMO data format
standard known as GRIB-1.
The land model output files of NLDAS-2 will also be hourly and in GRIB-1 format.
Appendix A provides web addresses to NCEP online GRIB-1 documentation,
source code and parameter tables. In particular, readers of this document should
read the discussion in Appendix A of GRIB-1 Parameter Tables.
The NLDAS-2 land surface forcing files and land model output files will apply
Parameter Table 130, which is oriented toward land/hydrology modeling.
The non-precipitation land surface forcing fields for NLDAS-2 are derived from
the analysis fields of the NCEP North American Regional Reanalysis (NARR).
NARR consists of 1) a 25-year retrospective (1979-2004) and 2) a daily update
execution at NCEP. The daily update provides a real-time NARR continuation
known as the Regional Climate Data Assimilation System, or R-CDAS.
NARR analysis fields are 32-km spatial resolution and 3-hourly temporal
frequency. Those NARR fields that are utilized to generate NLDAS-2 forcing
fields are spatially interpolated to the finer resolution of the NLDAS
1/8th-degree grid and then temporally disaggregated to the NLDAS hourly
frequency. Additionally, the fields of surface pressure, surface downward
longwave radiation, near-surface air temperature and near-surface specific
humidity are adjusted vertically to account for the vertical difference
between the NARR and NLDAS fields of terrain height. This vertical adjustment
applies the traditional vertical lapse rate of 6.5 K/km for air temperature.
The details of the spatial interpolation, temporal disaggregation and vertical
adjustment are those employed in NLDAS-1, as presented by
Cosgrove et al. (2003, JGR, Vol. 108).
The hourly land surface forcing fields for NLDAS-2 are grouped into two
GRIB files, "File A" and "File B". This is a change from NLDAS-1,
which had only one hourly forcing file.
FORCING FILE A:
File A is the primary (default) forcing file. It will contain the following eleven fields (units are given in parentheses):
1 - air temperature (K) ** at 2 meters above the surface
2 - specific humidity (kg/kg) ** at 2 meters above the surface
3 - surface pressure (Pa) **
4 - U wind component (m/s) at 10 meters above the surface
5 - V wind component (m/s) at 10 meters above the surface
6 - surface downward longwave radiation (W/m^2) **
7 - undefined
8 - CAPE: Convective Available Potential Energy (J/kg): from NARR
9 - potential evaporation (kg/m^2): from NARR
10 - precipitation hourly total (kg/m^2)
11 - surface downward shortwave radiation
** indicates a field to which the aforementioned vertical
adjustment is applied.
The first eight fields above are the traditional land surface forcing
fields, such as in PILPS (Project for Intercomparison of Land-Surface
Process Schemes) and GSWP (Global Soil Wetness Project).
The surface downward shortwave radiation field in File A is a
bias-corrected field wherein a bias-correction algorithm was
applied to the NARR surface downward shortwave radiation. This
bias correction utilizes five years (1996-2000) of the hourly
1/8th-degree GOES-based surface downward shortwave radiation
fields derived by Pinker et al. (2003). The bias correction
algorithm is described in Appendix B.
The precipitation field in File A is not the NARR precipitation
forcing, but is rather a product of a temporal disaggregation of
a gauge-only CPC analysis of daily precipitation, performed directly
on the NLDAS grid and including an orographic adjustment based on the
widely-applied PRISM climatology. The details of the method of
producing this precipitation forcing, including details of the
temporal disaggregation from the daily analysis to hourly intervals,
are given in Appendix C.
The field in File A that gives the fraction of total precipitation
that is convective is an estimate derived from the following two
NARR precipitation fields (which are provided in File B): NARR
total precipitation and NARR convective precipitation (the latter
is less than or equal to the NARR total precipitation and can be zero).
The convective fraction of total precipitation and/or the CAPE field
in File A are used by some land models to estimate the subgrid spatial
variability of the total precipitation.
The potential evaporation field in File A is that computed in NARR
using the modified Penman scheme of Ek and Mahrt (1982). ETP is
needed by some land models like the SAC model that require potential
evaporation as an input forcing.
FORCING FILE B:
One fundamental physical process represented in land modeling is the
surface aerodynamic conductance, which represents the intensity of the
near-surface vertical turbulence that transports heat and moisture
between the land surface and the overlying atmosphere.
There are many approaches to modeling the surface aerodynamic
conductance in boundary layer modeling in general, and in land
surface modeling. The results from NLDAS-1 showed a surprisingly
large difference among four different land models in the simulated
magnitude of the warm-season diurnal cycle of aerodynamic conductance.
The 2-meter temperature and specific humidity and 10-meter wind fields
applied in continental-scale land surface modeling studies are typically
products of the data assimilation/analysis systems of mainstream NWP
centers. The 2-meter and 10-meter levels in such analysis/assimilation
systems are rarely explicit levels in the background assimilating NWP
model of the given NWP center. Hence NWP centers diagnose these 2-meter
and 10-meter fields from the lowest prognostic level of the assimilating
model. This diagnostic derivation of 2-meter temperature and humidity
fields and 10-meter wind fields is done on the basis of A) those same
fields at the model's lowest prognostic level, which is usually well above
the 10-meter level (e.g. 20-200 meters above) and B) the given model's
method for modeling the aerodynamic conductance of the "surface layer",
also known as the "constant flux layer" -- i.e. applying the given model's
particular approach to such physical entities as the surface roughness
length for momentum, the surface roughness length for heat, surface layer
stability functions (e.g. similarity profile functions) and surface layer
parameters (e.g. mixing length).
NLDAS-2 is therefore providing a second forcing file, File B, in which
the surface temperature, humidity and wind fields are represented not at 2
meters and 10 meters above the height of the NLDAS terrain, but rather at the
same height above the NLDAS terrain as the height above the NARR terrain of
the lowest prognostic level of the NARR assimilation system (namely, the same
height above the model terrain as the lowest prognostic level of the mesoscale
Eta model, which is the assimilating model in NARR). We shall denote the
latter height as "H", and this height H varies spatially in the horizontal.
The motivation for this approach is to allow land models in NLDAS-2 to calculate
their aerodynamic conductance from surface forcing fields that are significantly
more independent (albeit not fully independent) of the aerodynamic conductance
approach applied in the assimilation/analysis system from which the surface
forcing fields were derived.
Specifically then, forcing File B of NLDAS-2 will contain the
following ten fields:
1 - NARR surface downward shortwave radiation (W/m^2) -- without bias correction
2 - NARR precipitation hourly total (kg/m^2)
3 - NARR convective precipitation hourly total (kg/m^2)
4 - NARR surface exchange coefficient [(kg/m^3)(m/s)]
5 - specific humidity (kg/kg) ** at H meters above the surface
6 - pressure (Pa) **
7 - air temperature (K) ** at H meters above the surface
8 - U wind component (m/s) at H meters above the surface
9 - V wind component (m/s) at H meters above the surface
10 - height H above the surface (m)
Fields 7-11 above are provided for additional reasons, which are discussed
next. Fields 7-8 are provided to permit land modeling sensitivity tests in
which the precipitation and solar radiation fields of File A are replaced by
their less accurate counterparts taken directly from NARR. Fields 8 and 9 are
the NARR fields used to derive the field of "fraction of convective
precipitation" in File A. Field 10 is a NARR flag indicating whether the
precipitation is rainfall or snowfall, based on the NARR's explicit cloud and
precipitation microphysics, and hence this flag is a function of the atmospheric
vertical profile of air temperature and humidity from the precipitating source
level in the cloud down to the land surface. This rainfall-snowfall flag is
likely a more reliable indication of rain versus snow at the ground then the
typical algorithms based on near-surface air temperature (such as the algorithm
used in NLDAS-1). Field 11 is the aerodynamic conductance obtained from NARR,
to allow comparison with the aerodynamic conductance computed independently by each
land model in NLDAS-2.
Appendix A: The GRIB-1 Data Format (Documentation, Code, Parameter Tables)
The NCEP online User's Manual for the GRIB-1 data format is available at:
http://www.nco.ncep.noaa.gov/pmb/docs/on388/
The NCEP web site providing Fortran-90 source code and documentation of code is:
http://www.nco.ncep.noaa.gov/pmb/codes/GRIB1/
The latter web site provides a link to the NCEP GRIB-1 User's Guide.
For a given physical variable, the GRIB data convention assigns the following:
1) a unique numeric ID known as the GRIB parameter ID (range 1-255)
2) a unique alphanumeric abbreviation (max of 8 characters)
3) required physical units.
The unique GRIB parameter IDs for given physical variables are provided
in tables known as GRIB parameter tables. The GRIB-1 Parameter Tables
formally recognized at NCEP are available online at
http://www.nco.ncep.noaa.gov/pmb/docs/on388/table2.html
At present (Dec 2007), NCEP formally recognizes five GRIB-1 Parameter Tables,
namely, Table 2, Table 128, Table 129, Table 130, and Table 140. Each of
these tables define up to a maximum of 255 physical variables and their
corresponding unique Parameter IDs. Additionally, each table has a Part 1 and
a Part 2. Part 1 is identical across all GRIB-1 Tables and provides a WMO
mandated list of 128 physical parameters and their WMO-mandated unique Parameter
IDs. Part 2 is defined locally by the originating center or agency and the list
of physical parameters in Part 2 is often aligned with a given physical specialty.
At NCEP for example, Part 2 of Table 128 is oriented somewhat toward ocean modeling
and ocean physics, and Part 2 of Table 129 is oriented somewhat toward cloud
microphysics.
The NLDAS-2 land surface forcing files and land model output files will utilize
GRIB-1 Parameter Table 130, which is oriented toward land/hydrology modeling
and land/hydrology physics.
The parameter IDs for Part 2 of Table 130 are available online at:
http://www.nco.ncep.noaa.gov/pmb/docs/on388/table2.html#TABLE130
The parameter IDs for Part 1 of Table 130 are identical to those of Table 2, online at:
http://www.nco.ncep.noaa.gov/pmb/docs/on388/table2.html#TABLE2
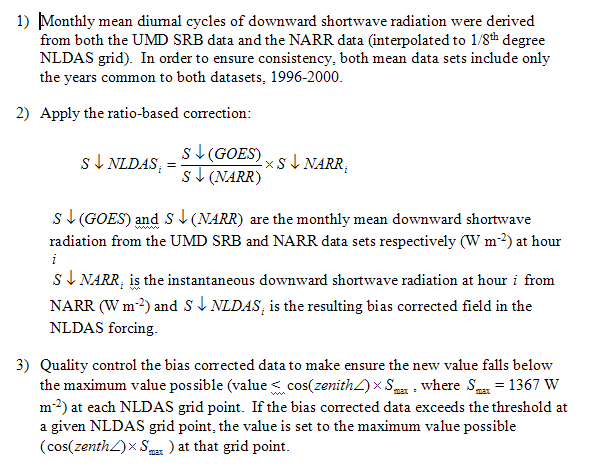
Appendix B: Bias Correction of Downward Shortwave Radiation for NLDAS-2
The NARR downward shortwave radiation field in the NLDAS-2 forcing files
(A-files) is bias corrected to University of Maryland Surface Radiation
Budget (SRB) data set produced under the auspices of the GEWEX Continental
Scale International Project (GCIP) and GEWEX Americas Prediction Project
(GAPP) (Pinker et al. 2003). Data from the GOES-8 satellite is processed
using an inference model to produce hourly estimates of downward shortwave
radiation fluxes. This dataset is produced on the native 1/8th degree NLDAS
grid and no interpolation is necessary. A ratio-based (Berg et al. 2003)
bias correction to the reanalysis downward shortwave radiation field was
completed as follows:
Appendix C: Generation of hourly precipitation forcing for NLDAS-2
The total precipitation field contained in File A is derived from CPC
daily CONUS gauge data (with the PRISM topographical adjustment), CPC
daily North American gauge data, hourly Stage 2 precipitation data,
half-hourly CMORPH data, and 3-hourly NARR precipitation data. Reflecting
the strengths of each data set, NLDAS precipitation is derived by using
the hourly Doppler radar and half-hourly CMORPH products to temporally
disaggregate the daily gauge products. This process, described in detail
below, capitalizes on the accuracy of the daily gauge product, and on the
temporal and spatial resolutions of the Doppler radar and CMORPH products.
CPC PRISM-adjusted daily gauge analyses serve as the backbone of the NLDAS
hourly precipitation forcing. Outside of the CONUS, where this dataset
is unavailable, CPC's 1 degree (0.25 degree after 2001) North American
daily gauge product is used instead. In NLDAS, these gauge-only daily
precipitation analyses are first processed to fill in any missing values,
and then are temporally disaggregated into hourly fields. This is accomplished
by deriving hourly disaggregation weights from NWS real-time, 4 km Stage II and
8km CMORPH hourly precipitation analyses. Stage II data is available from
1996 to the present, while CMORPH data is available from 2002 to the present.
The Stage II product consists of WSR-88D Doppler radar-based precipitation
estimates that have been bias corrected using hourly multi-agency gauge data
(Fulton et al., 1998), and mosaicked into a national product over the Continental
United States (CONUS) by NCEP/EMC (Baldwin and Mitchell, 1997). This CONUS
mosaic of the Stage II product is interpolated to 1/8th degree and any gaps
in radar coverage (which total on average 13% of the area of the CONUS and are
due to lack of radar coverage or equipment maintenance) are filled in with nearest
neighbor Stage II data from within a 2º radius. If no Stage II data are available,
then CMORPH data are used instead. CMORPH data is also used over the Mexican
portion of the NLDAS domain which is outside of the Stage II's region of coverage.
When CMORPH data is unavailable, NARR data is used instead. The patched, hourly
Stage II and CMORPH fields are then divided by fields of patched Stage II and CMORPH
daily precipitation totals to create hourly temporal disaggregation weights
representing the proportion of the 24 hour total precipitation which fell in each
hour. If the daily Stage II or CMORPH total is zero in an area of non-zero
CPC precipitation, hourly weights are set to 1/24 to spread the precipitation
evenly over the entire day. These hourly weights are then multiplied by the
daily gauge-only CPC precipitation analysis to arrive at temporally disaggregated,
hourly NLDAS fields. Since the Stage II and CMORPH data is only used to derive
the hourly disaggregation weights, a daily summation of these NLDAS precipitation
fields will exactly reproduce the original CPC daily precipitation analysis.
Since daily gauge and hourly precipitation data is sparse over Canada, NARR
precipitation is used over all Canadian regions within the NLDAS domain.
Rather than have an abrupt cutoff at the United States border, a one degree
wide blending area is used. In this region, precipitation forcing consists of
a weighted combination of the precipitation datasets discussed above.
REFERENCES
Baldwin, M., and K. E. Mitchell, The NCEP hourly multi-sensor U.S.
precipitation analysis for operations and GCIP research, in Preprints,
13th AMS Conference on Hydrology, pp. 54-55, Am. Meteorol. Soc.,
Boston, Mass., 1997.
Berg, A. A., J. S. Famiglietti, J. P. Walker, and P. R. Houser (2003),
Impact of bias correction to reanalysis products on simulations of
North American soil moisture and hydrological fluxes, J. Geophys.
Res., 108(D16), 4490, doi:10.1029/2002JD003334.
Cosgrove, B. A., et al. (2003a), Real-time and retrospective forcing
in the North American Land Data Assimilation System (NLDAS) project,
J. Geophys. Res., 108(D22), 8842, doi:10.1029/2002JD003118.
Fulton, R. A., J. P. Breidenbach, D. J. Seo, D. A. Miller, and
T. O'Bannon, The WSR-88D rainfall algorithm, Weather Forecasting,
13, 377-395, 1998.
Mitchell, K. E., et al. (2004), The multi-institution North American
Land Data Assimilation System (NLDAS): Utilizing multiple GCIP products
and partners in a continental distributed hydrological modeling system,
J. Geophys. Res., 109, D07S90, doi:10.1029/2003JD003823.
Pinker, R. T., et al., Surface radiation budgets in support of the GEWEX
Continental-Scale International Project (GCIP) and the GEWEX Americas
Prediction Project (GAPP), including the North American Land Data
Assimilation System (NLDAS) project, J. Geophys. Res., 108(D22), 8844,
doi:10.1029/2002JD003301, 2003.
This page was originally established by Brian Cosgrove who is working now at Office of Hydrological Development in NOAA.


 NLDAS Web Page