WSR2005
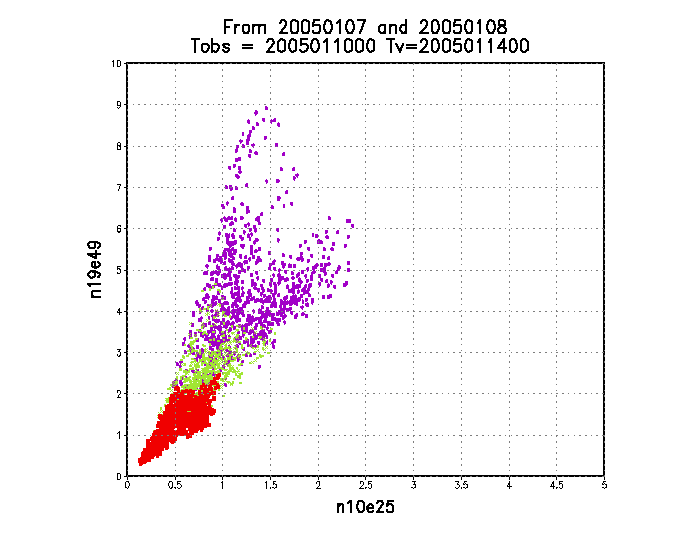
In 2005, we increased the total number of ensemble members that are used to calculate the impact of targeted observations from 35 to 68. The values of the expected forecast error reduction in verification region due to adpative observations shown on the "summary" charts, will be different from 2004. Below is a typical scatter plot reflecting the difference . Use this figure only as a reference as the values change from case to case.
Horizontal axis represents summary chart values from 35-member ensemble while vertical axis shows those from the 68-member ensemble. Different colors represent different observation-verification time windows (red: 12-24 hrs, gree: 36-48 hrs, purple:60-72 hrs). As observation time getting closer to verification time, the values of the expected forecast error reduction are smaller. VR region is at 41N, 90W. The ensemble initial time is Jan 07, 2005 and Jan 08, 2005 with observational time starting two days later.
