 EXTREME WEATHER EVENTS AND THEIR PROBABILISTIC PREDICTION
 EXTREME WEATHER EVENTS AND THEIR PROBABILISTIC PREDICTION
Yuejian Zhu1 and Zoltan Toth1
Environmental Modeling Center, NCEP, NWS/NOAA
Washington DC 20233
1. INTRODUCTION
It is the unusual and/or unexpected nature of extreme weather that makes these events significant to society. Extreme precipitation events, which are often associated with flooding or heavy winds, are of particular concern. For example, during the past three decades, the earthquake-prone states of California, Oregon and Washington combined have suffered as much loss of life due to floods as due to earthquakes, and the annually averaged levels of property loss are also comparable (Ralph 1999, personal communication). The effect of rare events like floods in forming the natural environment can also be catastrophic and much larger than the cumulative effect of near normal weather between the rare events. In section 2 of this paper we will first discuss different definitions of extreme weather events. Some general comments are given about the nature of these events in section 3. Issues related to forecasting extreme events (section 4) and their verification (section 5) are addressed next. The use of weather forecasts for extreme events are discussed in section 6, while a summary and discussion follow in section 7.
2. DEFINITION OF EXTREME EVENTS
Extreme meteorological events can be defined based on various criteria. Here we will distinguish among three possible definitions, based on climatological, forecast, and user specific information.
2.1 Climatological extremes
The most commonly used definition of extreme weather is based on an event's climatologically expected distribution. An event is called extreme in this sense if it is from
the tails of the climatological distribution, occurring, for example, only 5% or less of the time (Fig. 1)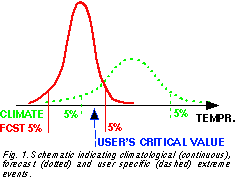 . The exact choice
of the cut-off climatological probability value used in the
definition is somewhat arbitrary. The term weather event is
used here in a broad sense, standing for a particular meteorological variable at a specific time and place, or for a specific temporal/spatial combination of meteorological variable(s) (like spatially averaged precipitation accumulated
over a period of time).
Extreme events, by definition, are rare. A simple example of extreme weather is when the temperature drops to a level which occurs less than 5% of the time, say below -20 C. Users/equipments/processes that are constantly exposed to outside temperatures and have to endure them must prepare for such events otherwise they necessarily sustain losses from time to time. Users/equipments/processes that are exposed to outside temperatures only for limited time periods, however, may not be prepared for such events because most of the time these events do not occur. Forecasts of extreme events may be especially valuable for such users since this allows them to either protect their activities (if this is not too expensive) or possibly reschedule them for times when no extreme weather is expected.
2.2 Forecast extremes
Forecast extremes are defined just as climatological extremes except that these events occur at or below a given forecast (and not climatological) probability level (Fig. 1). They represent extremes in a conditional climatological sense, conditioned on the given weather forecast (i. e., the initial state of the atmosphere, and the analysis and forecast methods).
Forecast extremes may or may not represent climatologically extreme values. Consider, for example, a wintertime minimum temperature forecast that calls for above freezing temperatures with 98% probability in an area where the climatological frequency of freezing temperatures is high. This forecast is very informative to a user who needs to schedule a procedure that can be performed only at above freezing temperature. At its extreme, however, the forecast allows for the occurrence of below freezing temperature with 2% probability. This has to be recognized by the user and he/she has to be prepared to absorb any potential losses should this scenario realize, or he/she should refrain from performing the temperature sensitive procedure in question.
2.3 User specific extremes
User specific extremes are defined here as weather events that lead to extreme conditions for a particular user (Fig. 1). User specific extremes are, for example, moderate precipitation falling on saturated soil that leads to flooding, or large and rapid fluctuations in temperature that may damage a particular manufacturing or construction process. These weather events are not necessarily extreme in a traditional sense yet they may trigger an extreme scenario of events for a user with a special sensitivity. In the remainder of the study, extreme events, if not specified otherwise, are defined in a climatological sense.
3. NATURE OF EXTREME EVENTS
Extreme events occur naturally in physical systems. The same physical processes that are responsible for generating non-extreme events are contributing to the occurrence of extremes. When the distribution of extreme events is considered in the phase space of a system, the extremes are found, by definition, near the edges of the distribution, at least in the directions/variables in which extremes are defined.
As any other event, extremes occur due to the combination of many factors. As an example, consider the factors leading to the occurrence of extremely low wintertime minimum air temperatures. A combination of several factors is needed, such as 100% snow cover on the ground, zero wind speed, lack of cloud cover (0%), and strong prior cold advection.
Nonlinear processes play a crucial role in determining the "edges" of climatological distributions beyond which the system would likely not venture. Note that all of the listed necessary conditions leading to the occurrence of extreme minimum temperatures is an extreme itself and all (except the last) condition represents an absolute minimum attainable in the system. It follows that arbitrary changes introduced to the trajectory of a system leading to an extreme event are likely to introduce modifications that will moderate (and not intensify) the extreme.
Special processes occurring only on small scales may be crucial in the formation of extreme events. The development of heavy convective precipitation is such an example. When the predictability of extreme events is considered one should therefore consider the primary effect of spatial scales. The predictability of extreme events thus has to be compared to that of non-extreme events of the same spatial scales.
4. FORECASTING EXTREMES
Extreme events are produced largely by the same processes as other events so they can be predicted by the same procedures used for predicting other events. The authors are not aware of any attempts at developing special tools for the sole purpose of predicting extreme events. Improvements in general forecast methods are expected to lead to incremental improvements in the methods' ability in forecasting extremes as well. As argued above, special processes may be of importance to the development of certain extreme events. Forecast model improvements targeted at these particular processes, such as those leading to heavy precipitation events, may also be effective in improving forecast performance for extreme events.
5. VERIFYING FORECASTS FOR EXTREMES
Predicting extreme conditions is generally considered a challenging task. Therefore the behavior of forecast models is sometimes scrutinized with respect to its performance in predicting extremes. As van den Dool and Toth (1991) pointed out, evaluating a forecast procedure separately for cases stratified according to the observed (or forecast) distribution like the extremes, however, has its limitations. In this section we review a few issues related to the verification of forecasts for observed/forecast extremes.
5.1 Systematic forecast behavior
Let us consider first forecast verification statistics for observed climatologically extreme cases. Even if the forecast model is perfect and the forecast fields follow exactly the same climatological distribution as the observed fields one would expect that for the cases identified in the observed set as climatologically extreme, the corresponding forecasts would be less extreme.
This is because, as pointed out in section 2, random perturbations in the initial conditions for the forecast are more likely to lead to less extreme conditions. Due to the strong nonlinearities involved in forming extremes, it is easier to make an event less extreme than more extreme. This was shown eloquently for Pacific North American teleconnection patterns in a perfect model forecast environment by Lin and Derome (1996). This is a general phenomenon and is most easily seen in cases when an absolute minimum or maximum exists, like forecasts verified for cases of zero observed precipitation amount. Forecasts can (and will in the presence of errors in the initial conditions) err only on one side (overpredicting precipitation), creating the appearance of a systematic model error. In fact this behavior is not a sign of model error but rather an artifact of evaluating a sample stratified based on observed extremes.
Forecasts verified for those cases with climatologically extreme forecast events, will tend to show an opposite systematic difference (underforecasting precipitation in our example). Combining the two samples stratified by observed and forecast extremes will rebuild part of the full, assumedly identical forecast and observed distributions.
5.2 Control vs. ensemble forecasts
As we saw above, systematic differences between forecasts and observations emerge, even when using a perfect model, simply due to a special stratification of the data - namely, verifying separately the cases with observed (or forecast) extreme events. One may expect that the use of an ensemble approach, where a number of forecasts started with slightly perturbed initial conditions to represent initial value uncertainty, would reduce this problem. This is not the case since the same nonlinearities responsible for the systematic differences are present in the ensemble forecasts.
This leads to ensemble mean forecasts that are less
extreme (and therefore somewhat less accurate) than
control forecasts started from the unperturbed initial condition, for the cases of observed extremes (Fig. 2)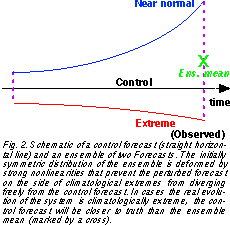 . Note,
however, that it is not known in advance whether the verification will be extreme. Also, the performance of the ensemble mean should be better than the control forecast for
the cases with forecast climatologically extreme events.
And since the mean of a properly formed ensemble, in an
overall expected sense, has a smaller forecast error than
a single control forecast, the likely best forecast approach
to predicting extremes is still based on the use of an ensemble of forecasts.
5.3 RMS error
Note that the overall distribution of atmospheric states in the phase space can be approximated by a multinormal distribution (Toth, 1991). Commonly used measures of forecast performance like the RMS error do not reflect the underlying structure of the attractor and lead to errors that assume larger values for cases with either extreme verifying or forecast conditions.
For example, Toth (1992, Fig. 2 there) found that persistence circulation forecasts have larger RMS errors for more extreme cases; and Ziehmann (2000) found the same for extreme near surface temperature forecasts. These results are expected even with a perfect model since the trajectories of atmospheric states are further apart in an RMS sense near the edges of the distribution (Fig. 1 of Toth 1995), making forecast errors for a perfect model necessarily larger in these phase space areas.
5.4 Error in categorical forecasts
van den Dool and Toth (1991) argued that forecasts
for extreme categories (intervals with an open end, in contrast with closed intervals) are found more successful by
most measures because it is "easier" for the verifying analysis to escape from a closed interval than from an open ended one. Similar statistical arguments, based on the distribution characteristics of weather elements or variables
can be made for probabilistic forecasts issued and verified
for extreme vs. near average categories. Assuming that
the shape of the forecast density distribution is independent of the mean of the forecast distribution we find that
there is a wider range of probability values used for the extreme categories, compared to a closed category (Fig. 3)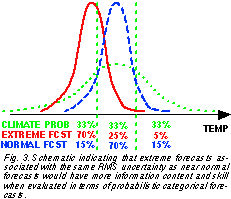 ,
directly leading to higher resolution (see, e. g., Stanski et
al 1989) in terms of Brier skill scores, for example.
These simplistic assumptions and arguments are justified when the Brier skill score is computed separately for
10 individual climate bins for 500 hPa height NCEP ensemble (Toth and Kalnay, 1997) forecasts (Fig. 4)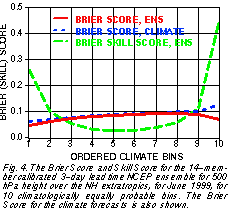 . Moreover, Brier score (Fig. 5
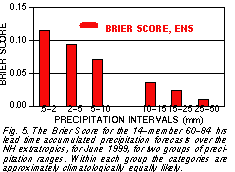 ) and Hit Rate (HR) and False alarm
Rate (FR) results (Fig. 6
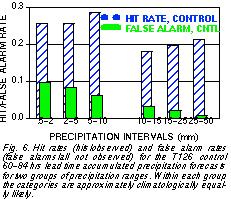 ) for 24-hr accumulated precipitation confirm the notion that in these measures forecasts for
more extreme events appear to verify better. Similar results were reported by Atger (2000).
6. USE OF EXTREME FORECASTS
Irrespective of whether a user relies on climatological or forecast information, he/she has to be prepared for extremes. Returning to our example from section 2, if there is a 2% chance that below freezing temperatures would develop, the user has to be prepared to absorb the associated losses - or refrain from performing the temperature sensitive procedure in question. A simple analysis of the user's overall expenses (cost of protecting against adverse weather, C, against loss of property/revenue due to adverse weather without protection, L) indicates that the users should consider the probability level P=C/L as their decision criterion for optimizing their behavior (Katz and Murphy 1997). In other words, the higher their potential losses are compared to the cost of protection (or delay of an operation in our case), the lower their tolerance is for the occurrence of adverse weather.
This kind of analysis is necessary to optimize user behavior yet can only be performed when using probabilistic forecast information. Note that single value forecasts can also be converted to probabilistic forecasts, though their value may be below those based on an ensemble of forecasts that reflects potentially large case dependent variations in forecast skill (Toth et al. 2000).
From the above example one can see that it is imperative that the users apply probabilistic forecast information
in their decision making process. Due to approximations
and errors in model and ensemble formation, probabilistic
forecasts are generally not reliable in a sense that forecast
probabilities of a given event do not necessarily match observed frequencies of the event. In case of ensemble
based probabilistic forecasts reliability, however, can be
assured with the use of a simple postprocessing algorithm
based on recent verification statistics (Zhu et al. 1996; Toth
et al. 1998). Fig. 7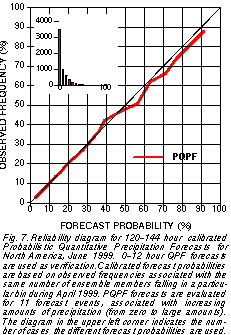 shows an example of Probabilistic
Quantitative Precipitation Forecasts (PQPF) demonstrating that forecasts calibrated in an operational setting exhibit close to perfect reliability.
7. SUMMARY AND DISCUSSION
Observed extreme weather events have a profound impact both on society and on natural processes surrounding the atmosphere, often making a disproportionately large impact. In this paper we first reviewed three definitions of extreme events, based on the climatological or forecast probability distributions, or user specific conditions. It was argued that extreme weather is created largely by the same processes that lead to other events, except that nonlinear processes play a major role in defining the edge of climatologically yet possible (extreme) events. It was noted that due to these nonlinearities it is generally easier to moderate than to intensify extremes by introducing changes in initial conditions.
It was pointed out that systematic differences (possibly perceived as model biases) between forecast and observed fields verified according to observed or forecast extreme values exist even when using a perfect model, due to the nonlinearities associated with the extreme events. It was also shown that forecasts for observed extremes are expected to appear poorer than forecasts for near normal events when using RMS error to measure forecast performance, while better when evaluating probabilistic categorical forecasts. This behavior can be explained by statistical characteristics of the forecast and climatological observed distributions. The answer to the question of the predictabilty of extreme events, compared to other events, thus seem to be norm dependent.
As a possible avenue for improving forecasts of extreme events, the enhanced modeling of the special nonlinear processes associated with these events was emphasized. It was also pointed out that users of weather forecasts interested in extreme events need to use and properly interpret probabilistic (in contrast to single value) forecasts.
8. ACKNOWLEDGEMENTS
We benefitted from discussions with Mark Iredell of NCEP and Marty Ralph of NOAA/ERL. We acknowledge the support and encouragement of Stephen Lord, Director of EMC.
9. REFERENCES
Atger, F., 2000: Verification of intense precipitation forecasts from single models and ensemble prediction systems. Nonlinear Processes in Geophysics, under review.
Katz, R. W., and A. H. Murphy, 1997: Economic value of weather and climate forecasts. Eds., Cambridge University Press, 222 pp.
Lin, H. and J. Derome, 1996: Changes in predictability associated with the PNA pattern. Tellus, 48A, 553-571.
Stanski, H. R., L. J. Wilson, and W. R. Burrows, 1989: Survey of common verification methods in meteorology. WMO World Weather Watch Technical Report No. 8, WMO/TD. No. 358.
Toth, Z., 1991: Circulation patterns in phase space: A multi-normal distribution, Mon. Wea. Rev., 119, 1501-1511.
Toth, Z., 1992: Quasi-Stationary and transient periods in the Northern Hemisphere circulation series. J Climate, 5, 1235-1247.
Toth. Z., 1995: Degrees of freedom in Northern Hemisphere circulation data. Tellus, 47A, 457-472.
Toth, Z., and E. Kalnay, 1997: Ensemble forecasting at NCEP and the breeding method. Mon. Wea. Rev, 125, 3297-3319.
Toth, Z., Y. Zhu, T. Marchok, S. Tracton, and E. Kalnay, 1998: Verification of the NCEP global ensemble forecasts. Preprints of the 12th Conference on Numerical Weather Prediction, 11-16 January 1998, Phoenix, Arizona, 286-289.
Toth, Z., Y. Zhu, and T. Marchok, 2000: On the ability of ensembles to distinguish between forecasts with small and large uncertainty. Weather and Forecasting, under review.
van den Dool, H. M., and Z. Toth, 1991: Why do forecasts for "near normal" often fail? Weather and Forecasting, 6, 76-85.
Zhu, Y, G. lyengar, Z. Toth, M. S. Tracton, and T. Marchok, 1996: Objective evaluation of the NCEP global ensemble forecasting system. Preprints of the 15th AMS Conference on Weather Analysis and Forecasting, 19-23 August 1996, Norfolk, Virginia, p. J79-J82.
Ziehmann, C., 2000: Skill prediction of local weather forecasts based on the ECMWF ensemble. Nonlinear Processes in Geophysics, under review.