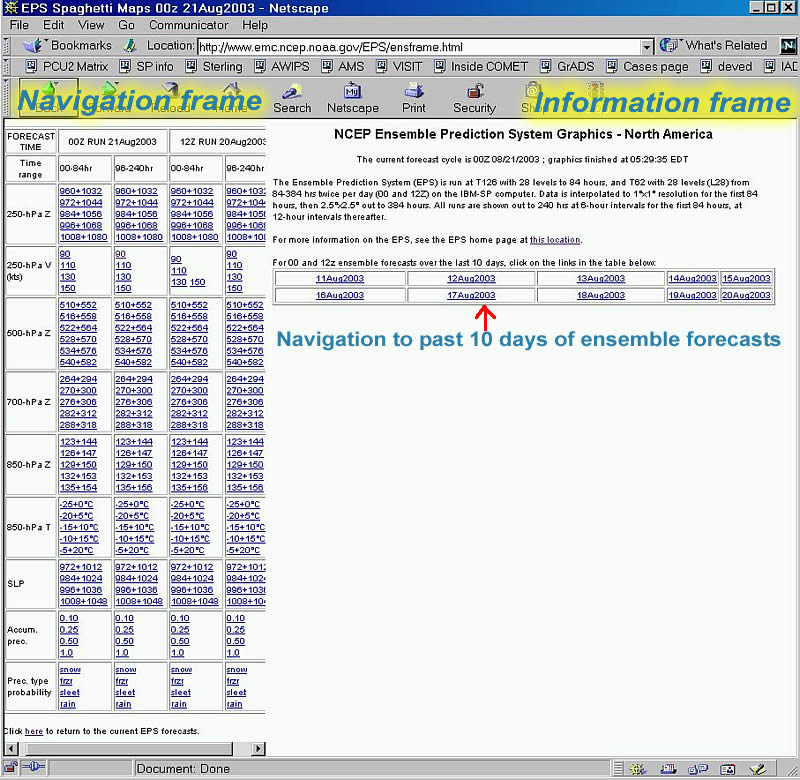
A graphic depicting the frameset containing the web page for the MREF spaghetti diagrams appears below. The format is current as of the 00 UTC MREF ensemble run of 21 August 2003, but is subject to change. When changes are made, this page will be updated to help with the new navigation.
On the left is a navigation menu, while on the right is information on the most recent run available. The information frame content includes:
Clicking on the tabular links changes the navigation menu to the left, to that of the date clicked. Both 00 UTC and 12 UTC MREF runs are available from these earlier date navigation menus.
For the current forecasts, the navigation frame menu has graphical links to the most recent MREF forecasts and the previous run. In this case, because the most recent run was at 00 UTC 21 August 2003, the 12 UTC run is from 20 August 2003. See the last column of the reproduced navigation menu table below for a descrption of the items contained in each row.
|
FORECAST TIME |
00Z RUN 21Aug2003 |
12Z RUN 20Aug2003 |
MREF run time. Most recent run can be either in 1st or second set of columns...make sure to check the date as well as the hour! |
||
|
Time range |
00-84hr |
96-240hr |
00-84hr |
96-240hr |
0-84 hours: graphics at 6-hr intervals from 00-84 hours 96-240 hours: graphics at 12-hr intervals from 96-240 hours |
|
250-hPa Z |
250-hPa height in decameters. Graphics contain two sets of forecast contours at values as indicated. |
||||
|
250-hPa V (kts) |
250-hPa wind velocity in kts. Each link indicates speed that is contoured. |
||||
|
500-hPa Z |
500-hPa height in decameters. Graphics contain two sets of forecast contours at values as indicated. |
||||
|
700-hPa Z |
700-hPa height in decameters. Graphics contain two sets of forecast contours at values as indicated. |
||||
|
850-hPa Z |
850-hPa height in decameters. Graphics contain two sets of forecast contours at values as indicated. |
||||
|
850-hPa T |
850-hPa temperatures in °C. Graphics contain two sets of forecast contours at values as indicated. |
||||
|
SLP |
Sea level pressure in hPa. Graphics contain two sets of forecast contours at values as indicated. |
||||
|
Accum. prec. |
24-hour accumulated precipitation in inches. Each link indicates accumulated precipitation that is contoured. |
||||
|
Prec. type probability |
Precipitation type probabilities (not spaghetti!); shading gives percentage of members indicating probability for indicated precipitation type. |
||||
|
Click here to return to the current EPS forecasts. |
Clicking on the link to the left will return you to the most current MREF forecast available, if you are using a menu from a prior date. |
||||
Let's say we click on one item in the navigation frame menu; the 534 and 576 decameter height contours for 96-240 hours. A snapshot of the resulting web pages from the 00 UTC 21 August 2003 ensemble run is shown below.
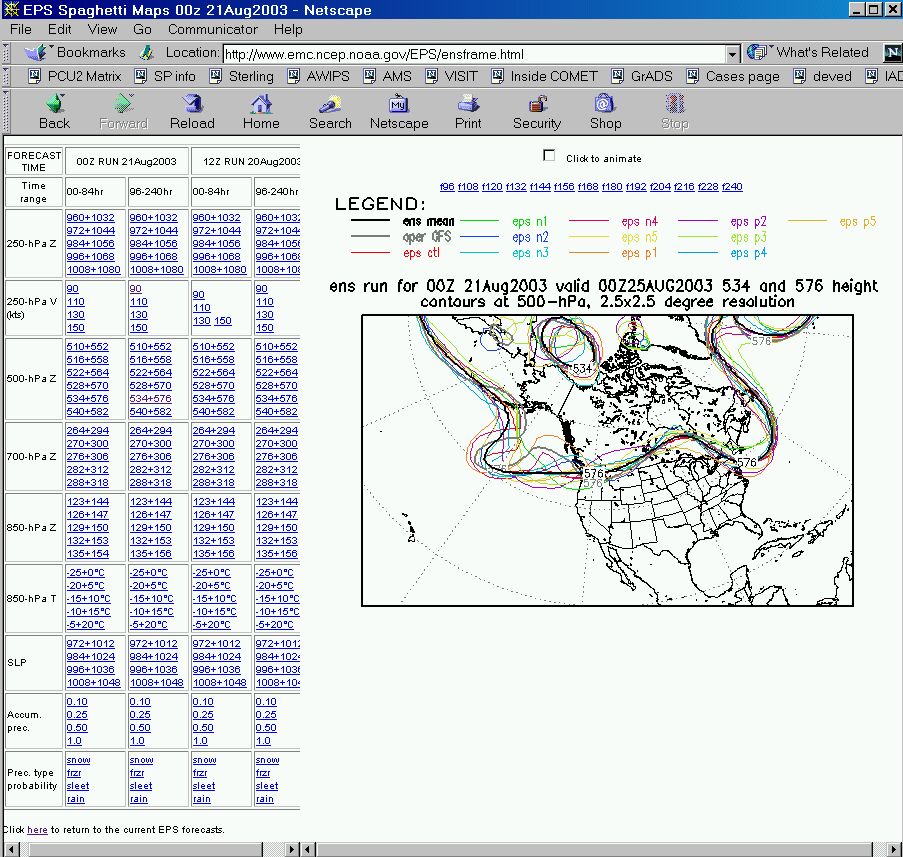
Note that a graphic for the first forecast hour in the 96-240 hour series appears on the right, along with:
All forecast hour graphics in the 96 to 240 hour range can thus be viewed, either individually or in an animation. All other variable types work similarly.