s
==>
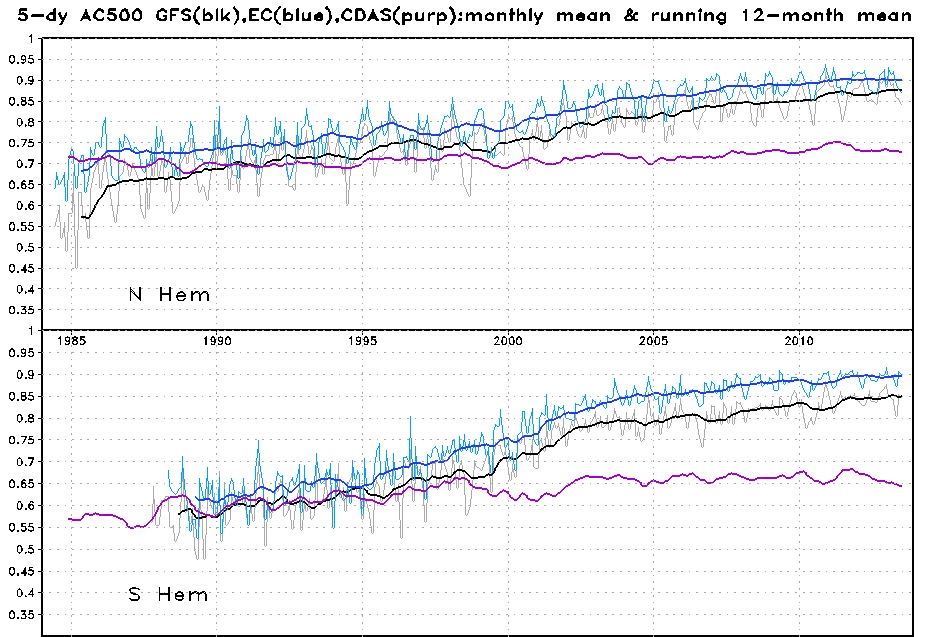
Time series of monthly mean anomaly correlations for 5-day forecasts of 500-hPa
heights with 12-month running means plotted at at the end of the year for GFS(black),
EC(blue), and CDAS frozen model (purple) since 1984, northern hemisphere (top) and
southern hemisphere(bottom).


