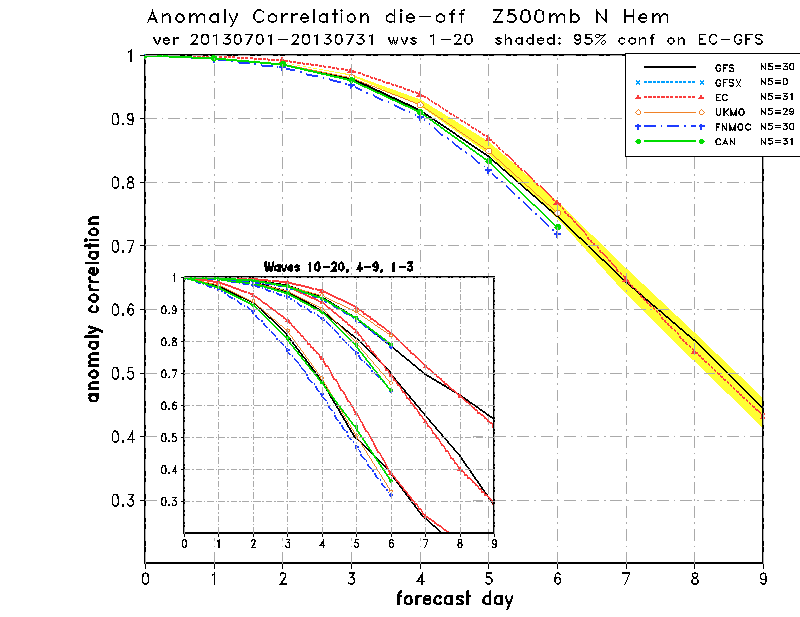
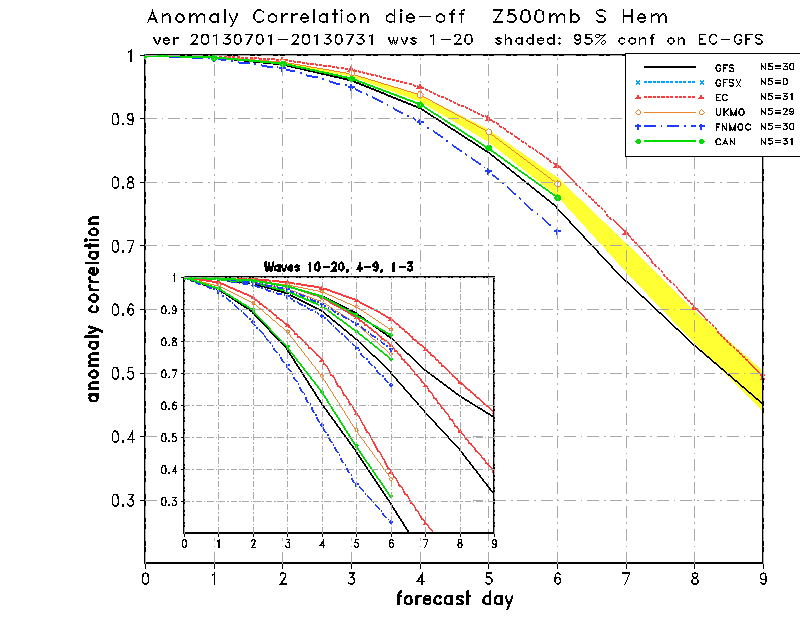
Time average of anomaly correlations for forecasts of 500-hPa heights
as a function of forecast day, verifying during the indicated time period
for 20-80 deg N (top) and 20-80 deg S (bottom).
These "die-off" curves are plotted for total fields and three
wave number groups. Numbers of cases for each model are indicated.
These "die-off" curves are plotted for zonal waves 1-20 (large curves) and three
other wave number groups (inset). Numbers of cases for each model are indicated.


